
Urbanie & Urbanus
Issue 2026 Aug
Empathetic and Inclusive Design
Issue 14, P. - P.
Wet Market Supply Chain in Hong Kong: Risk Management and Adaptive Spatial Interventions
Figures
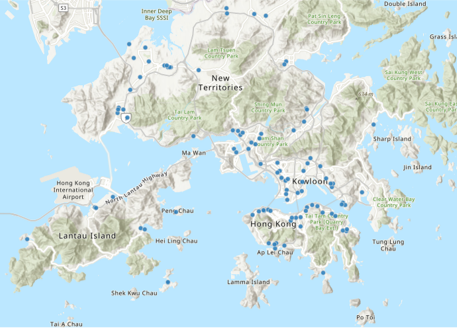
Figure 1. Distribution Map of Hong Kong Wet Markets, Source: https://opendata.esrichina.hk/datasets
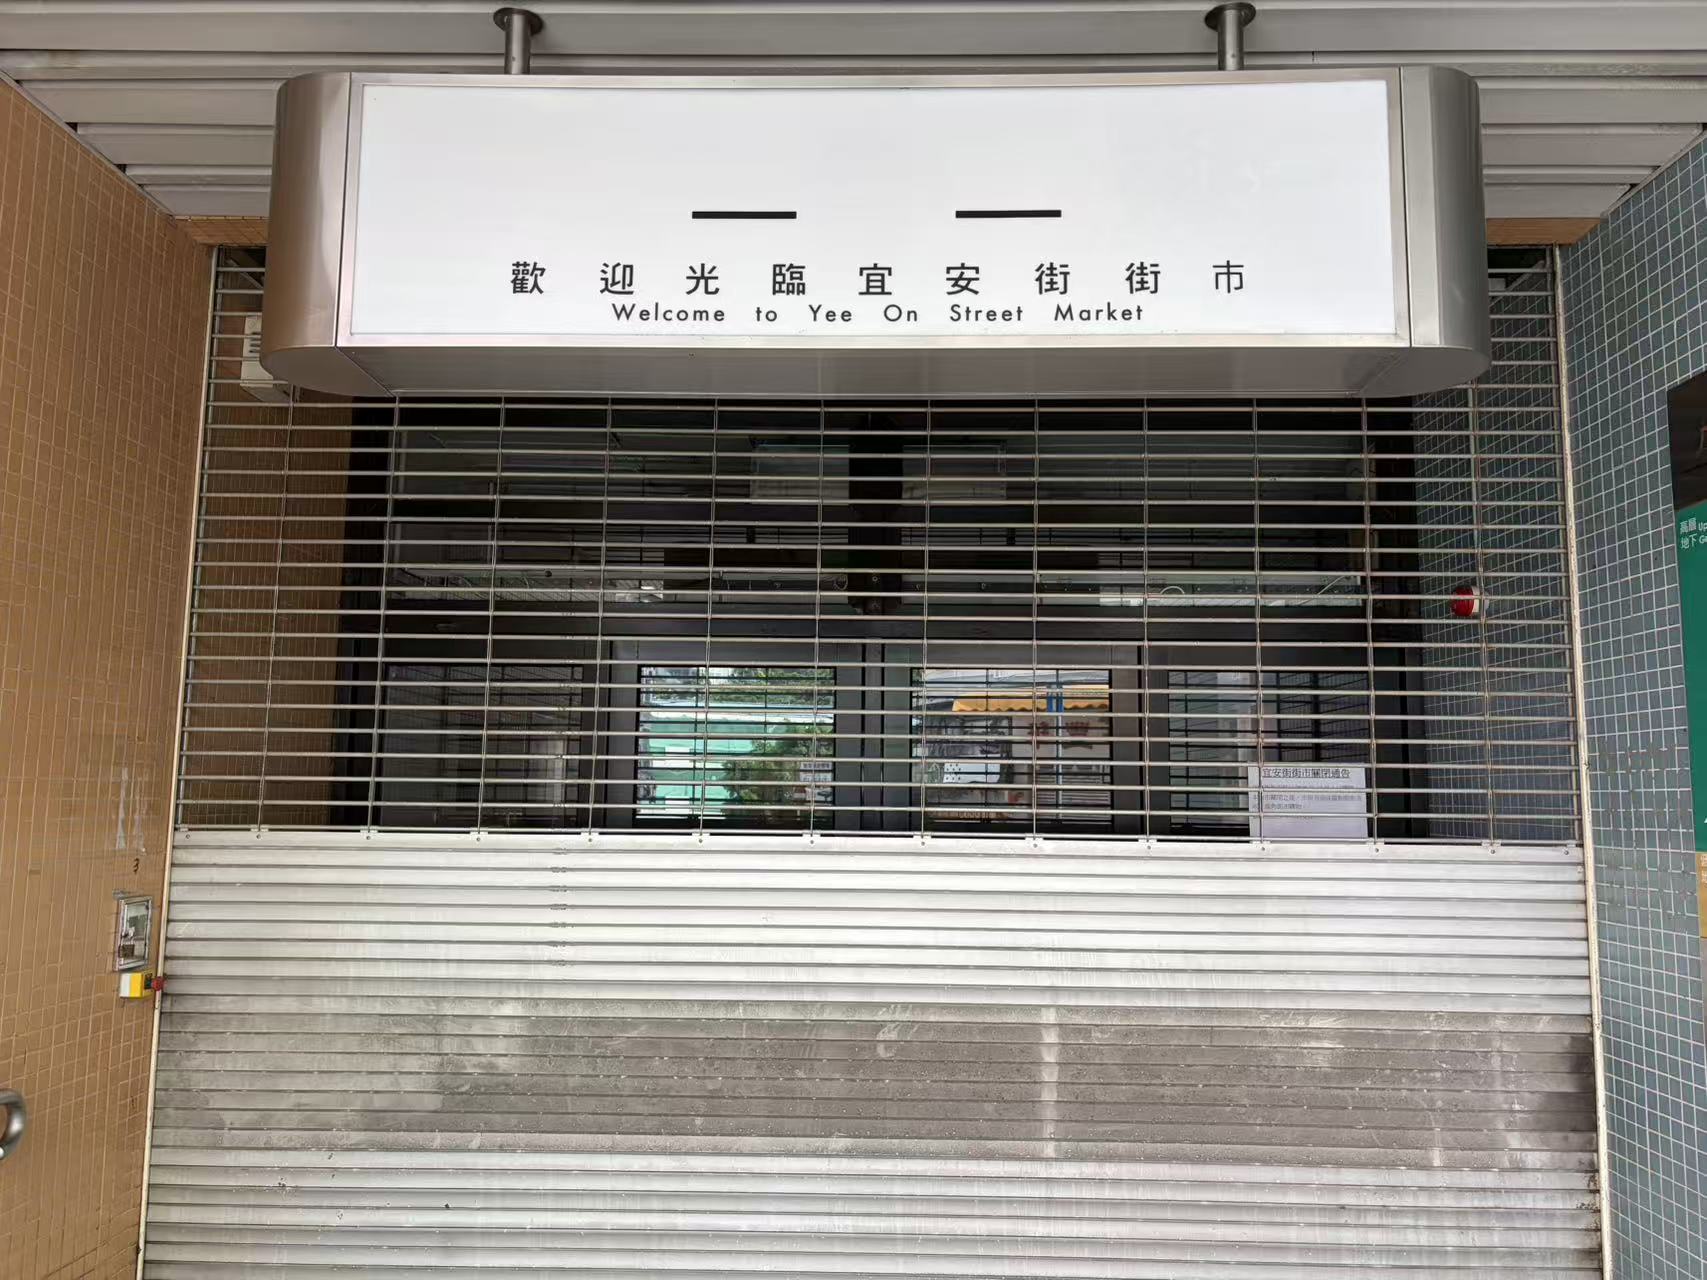
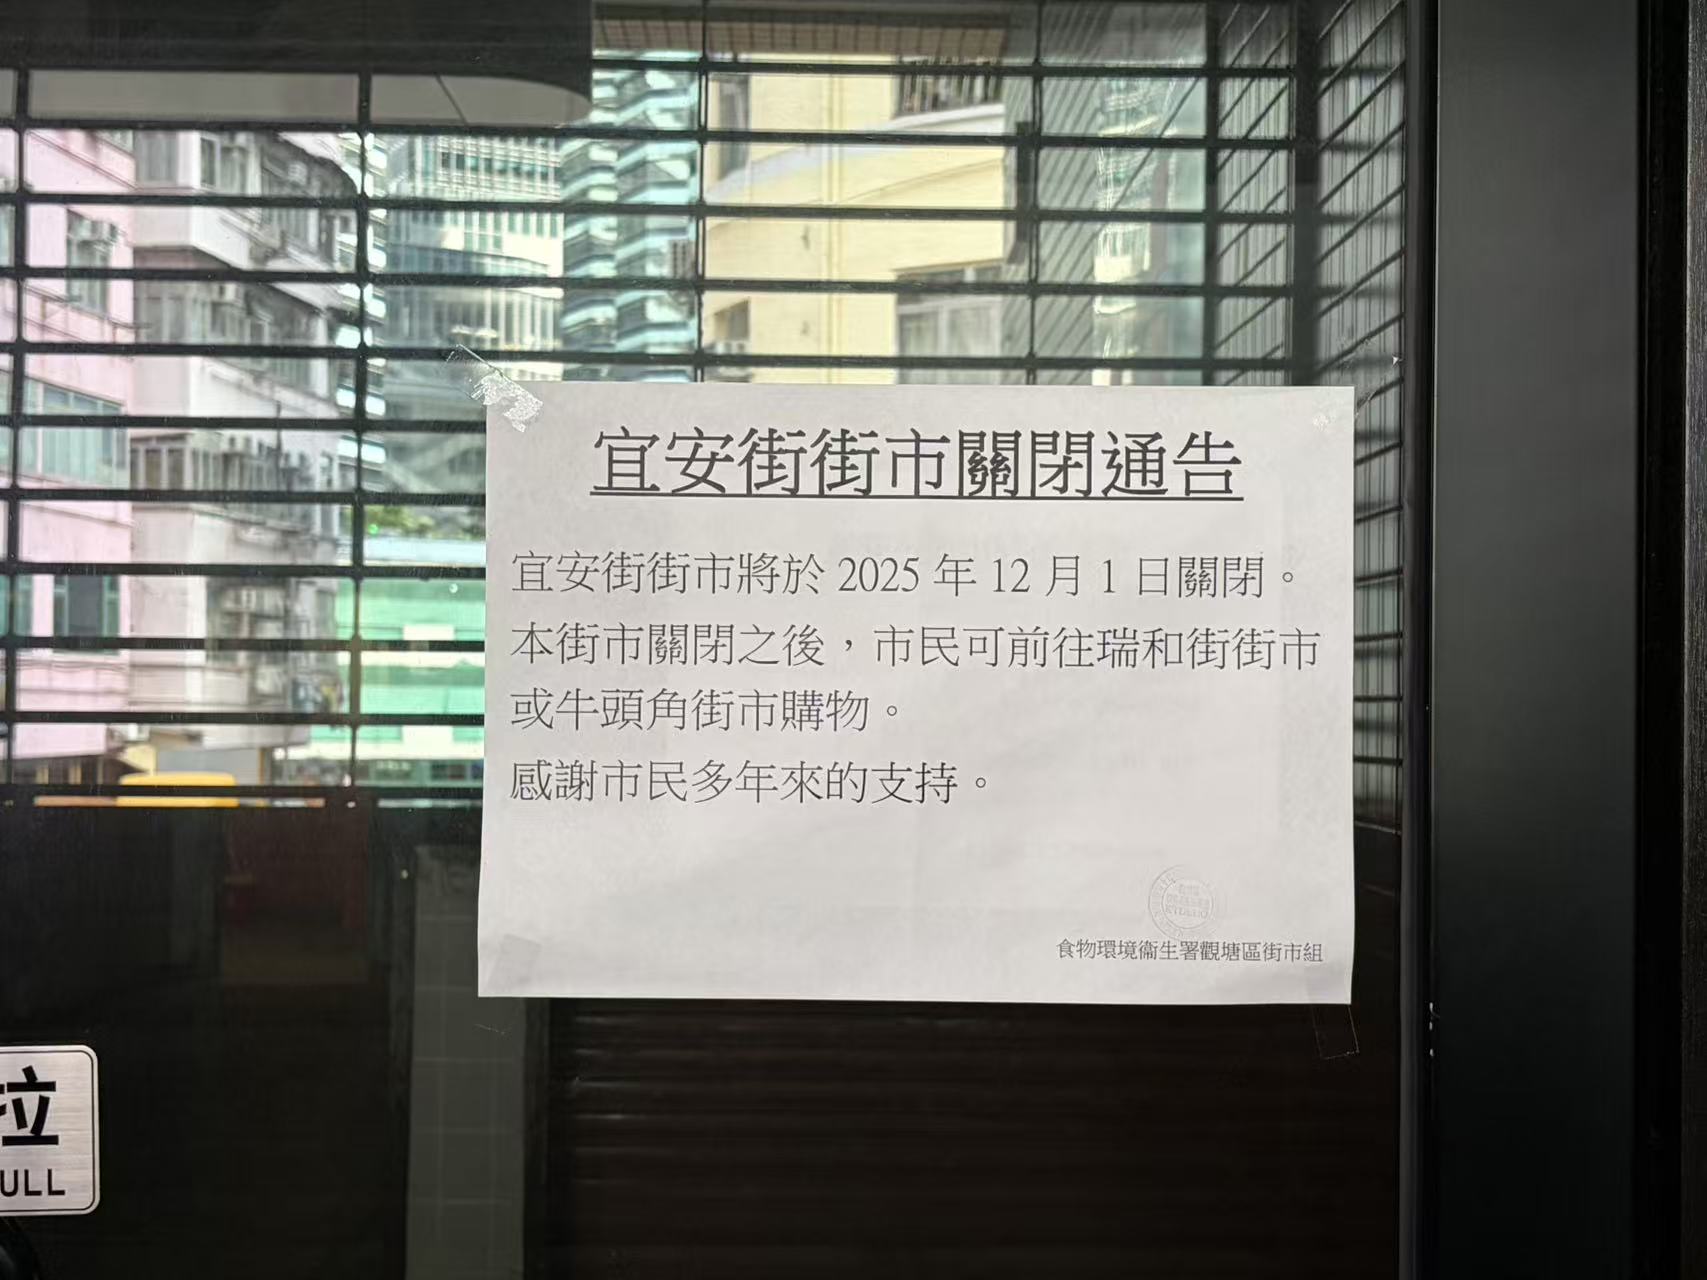
Figure 2. Closed Yee On Street Market during field observation
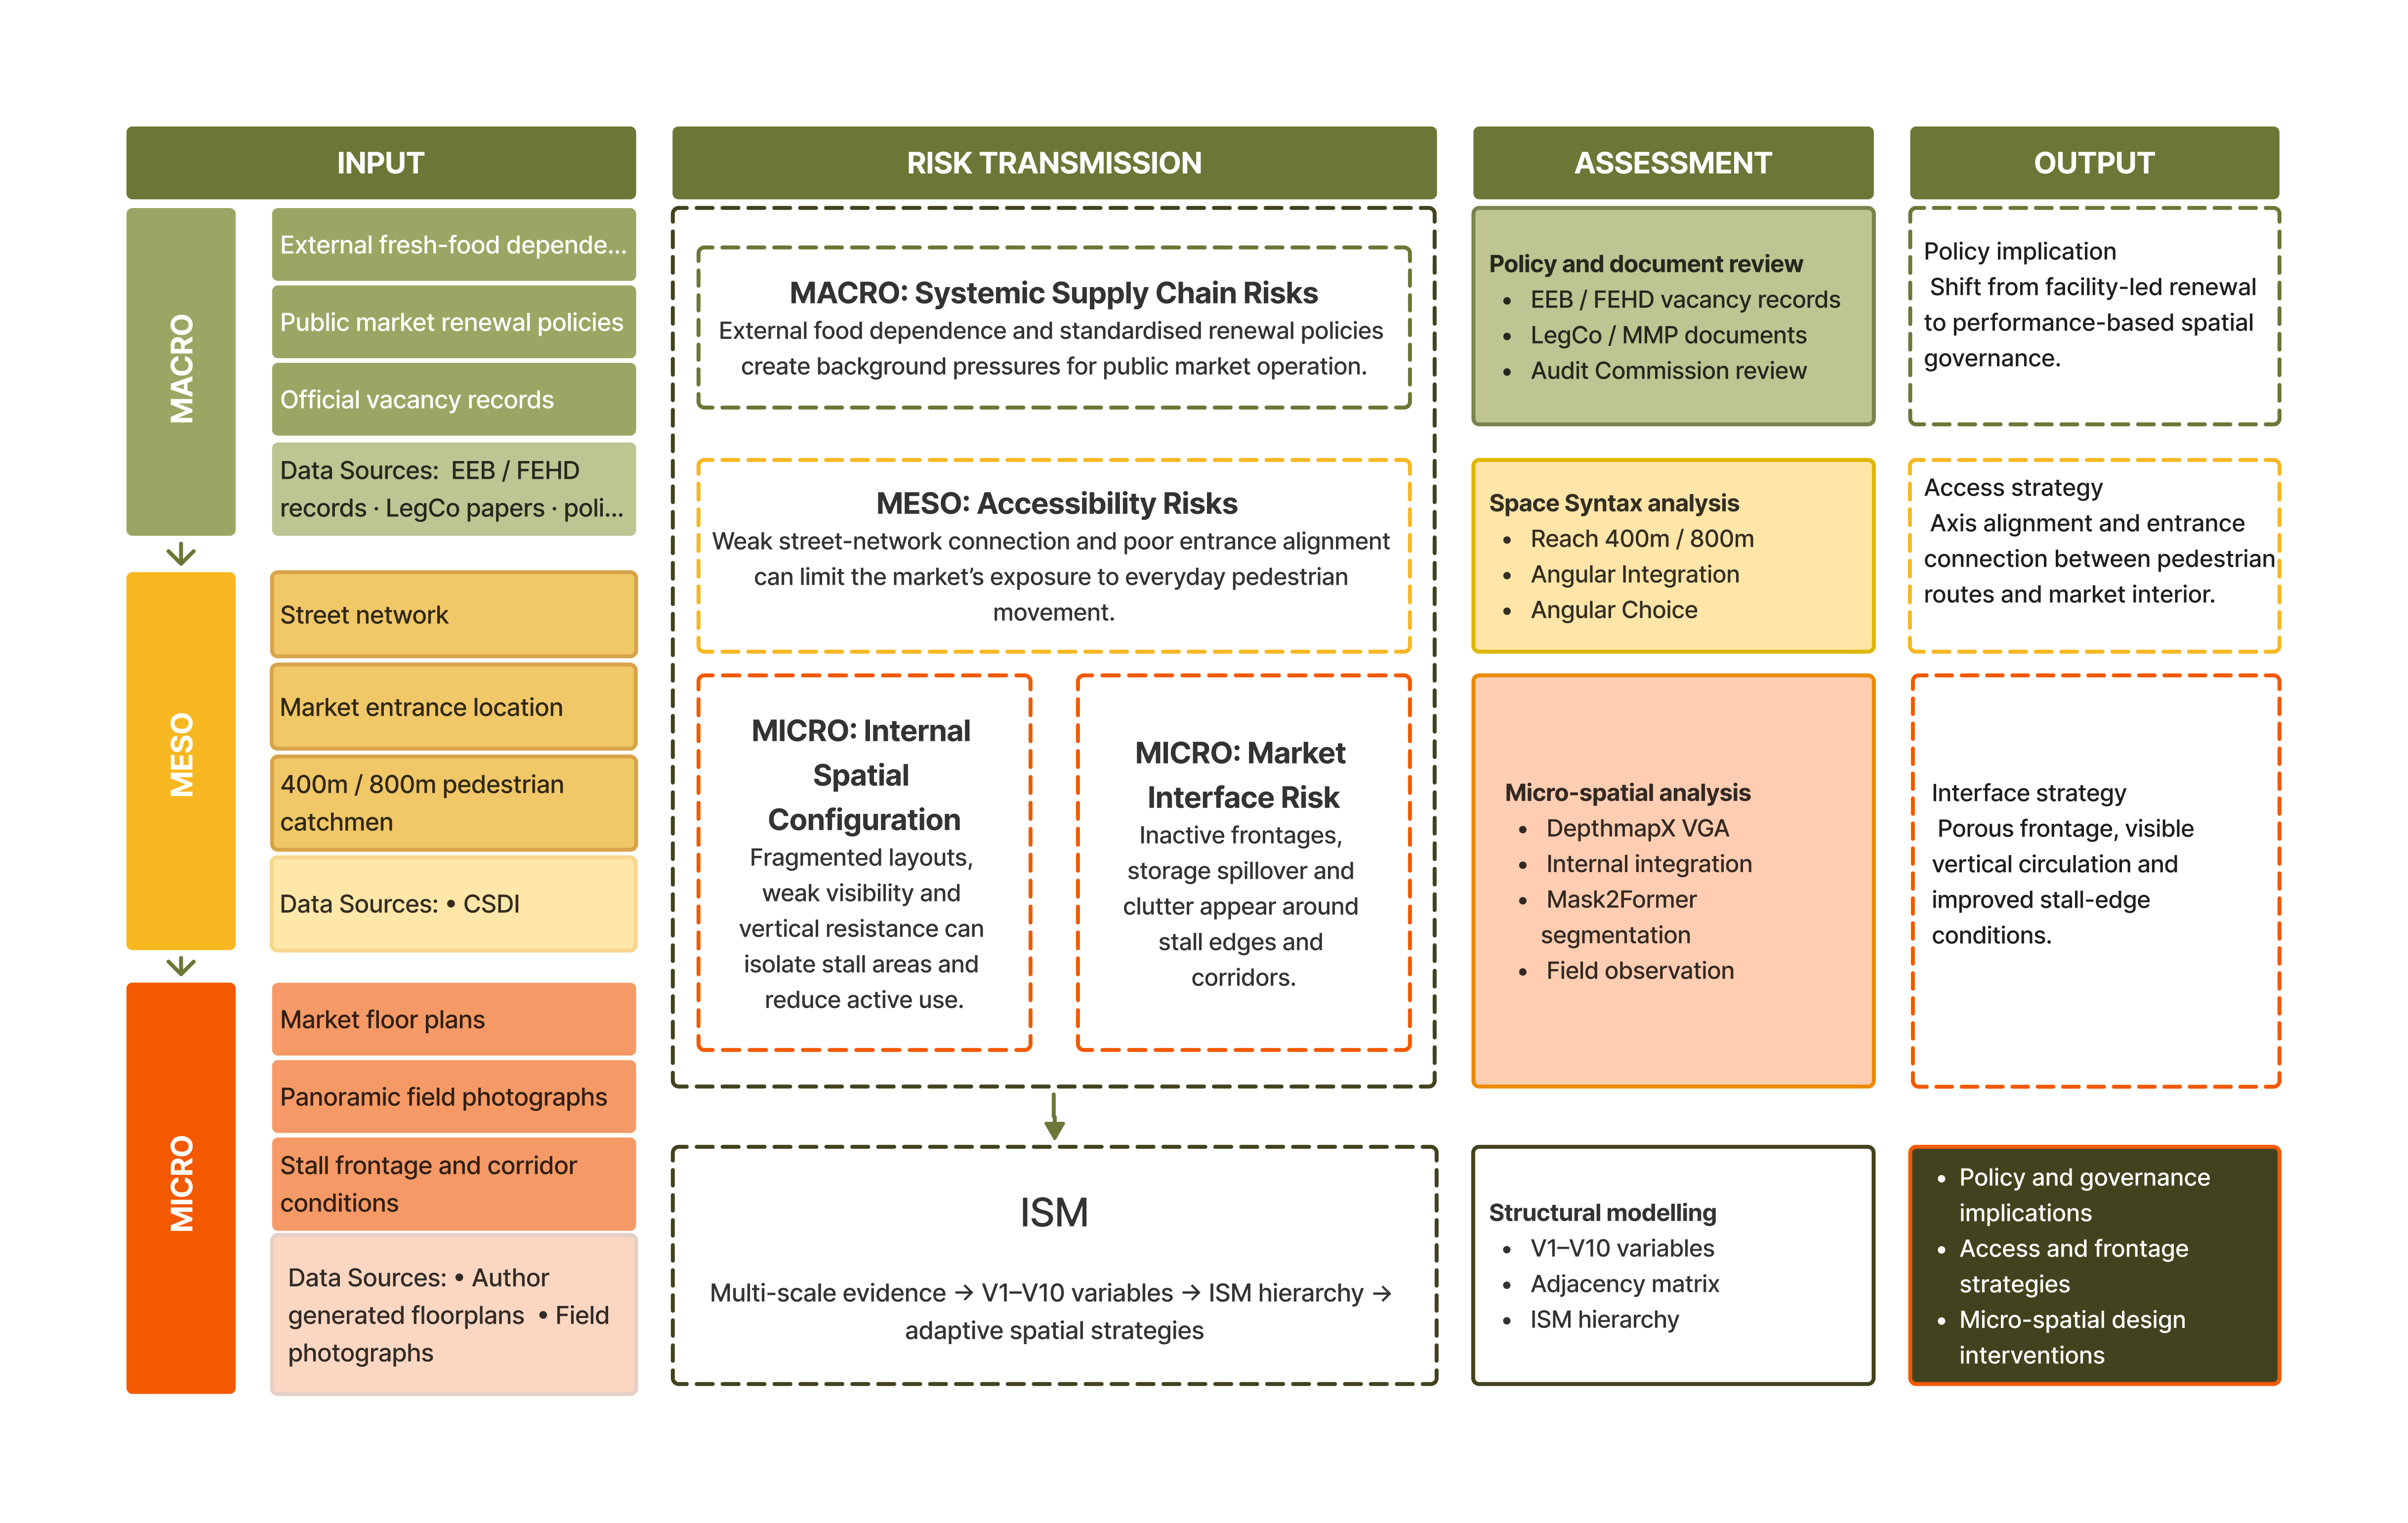
Figure 3. Framework

Figure 4. Reach 400m

Figure 5. Reach 800m

Figure 6. Angular Integration 45°

Figure 7. Angular Choice 45°

Figure 8. Visibility Graph Analysis

Figure 9. Integration
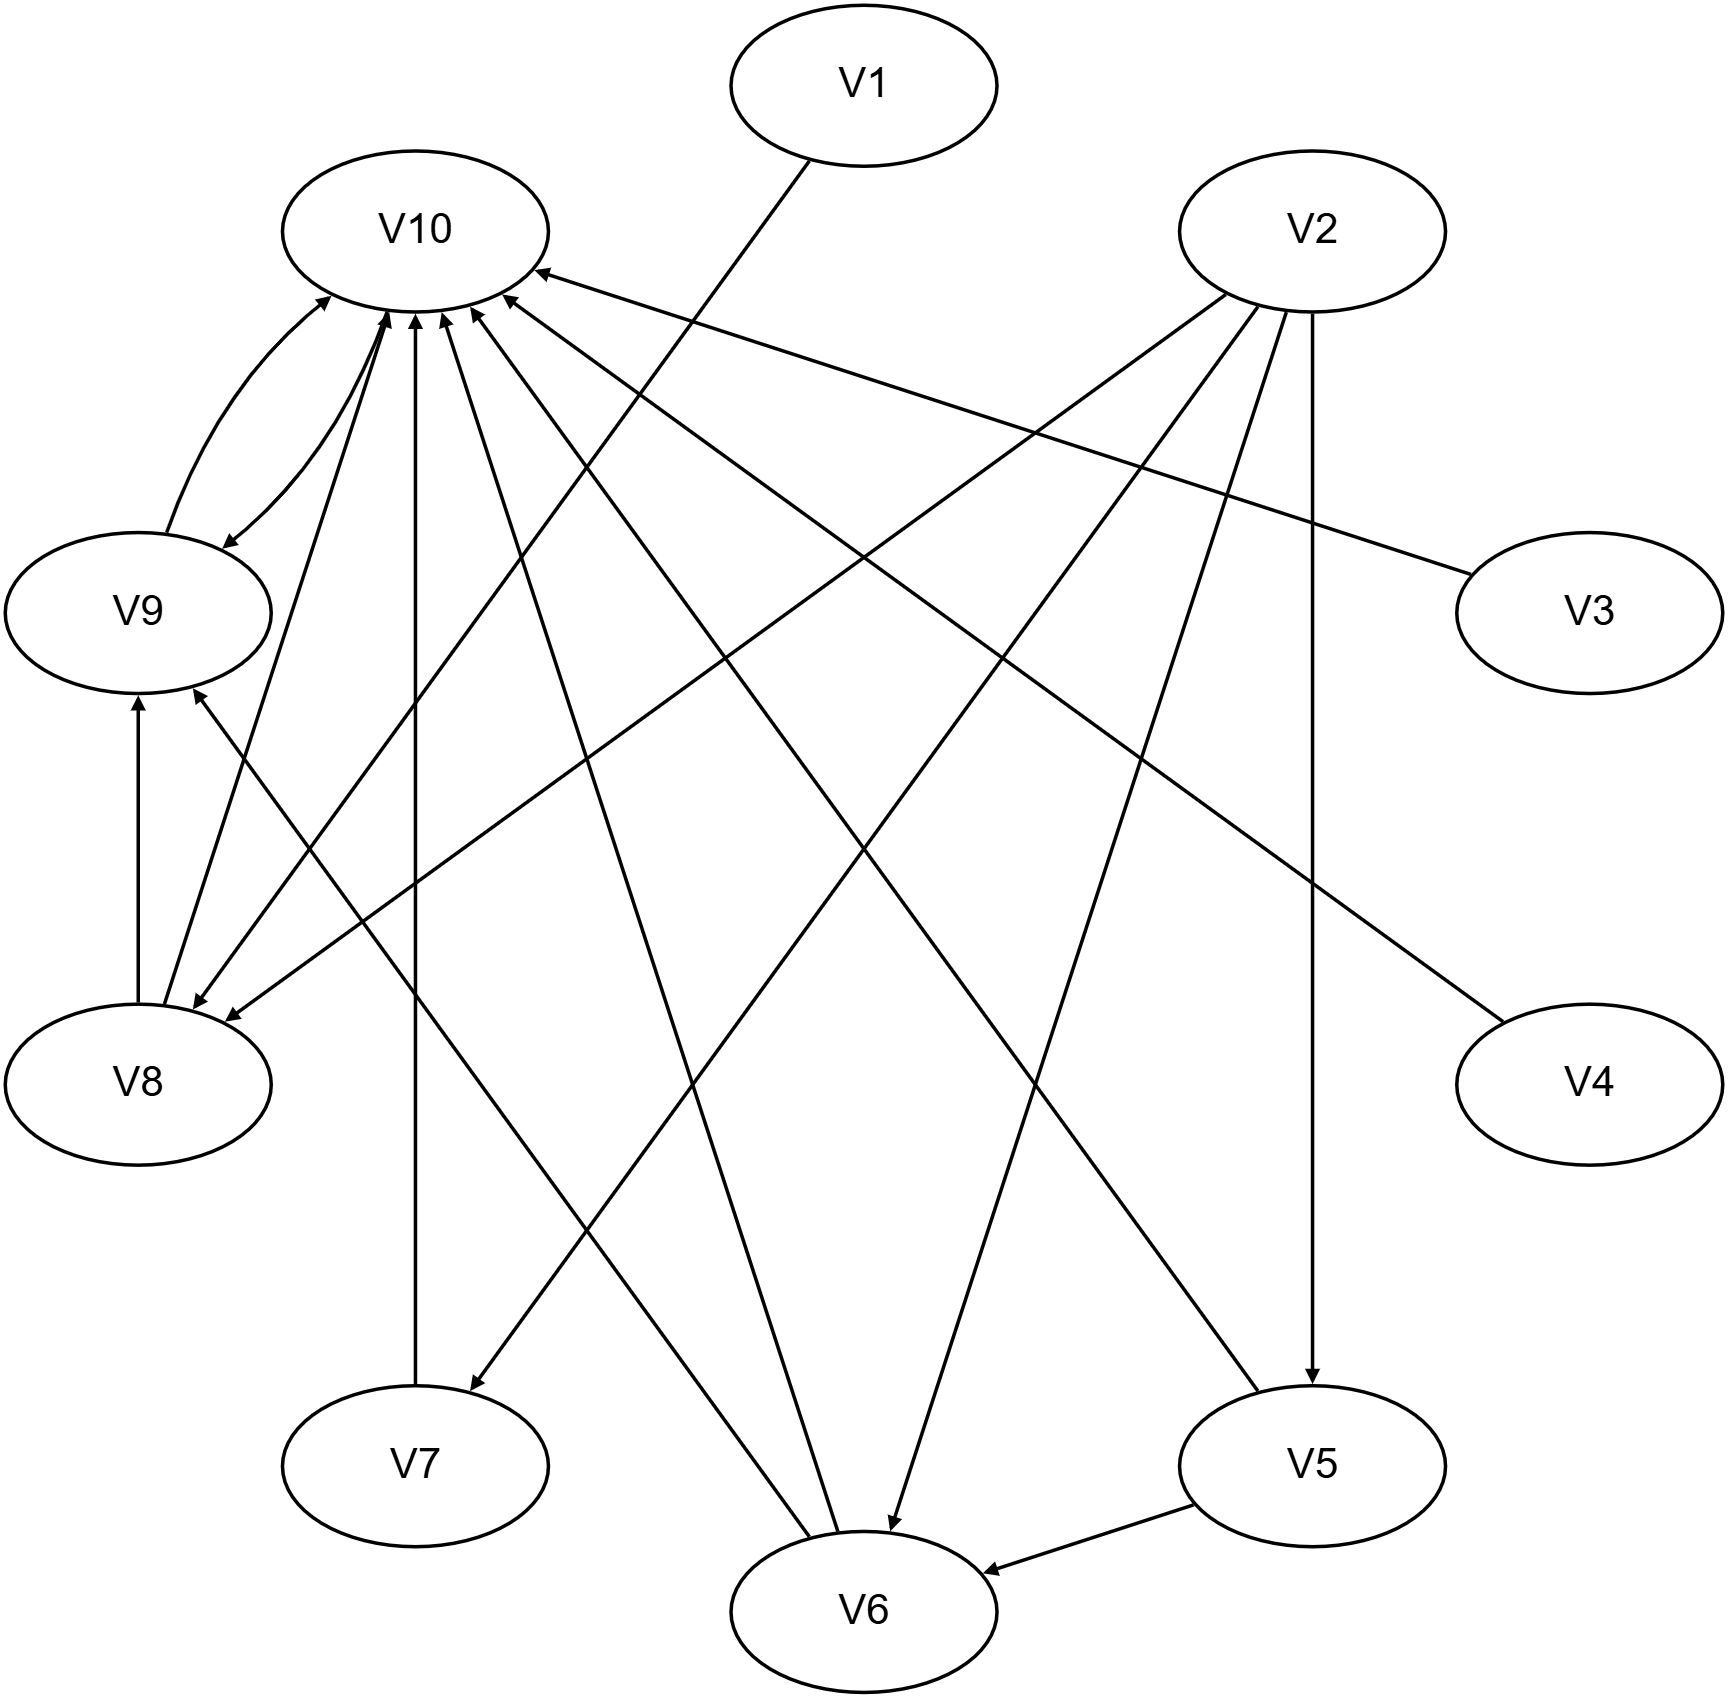
Figure 10. ISM directed graph
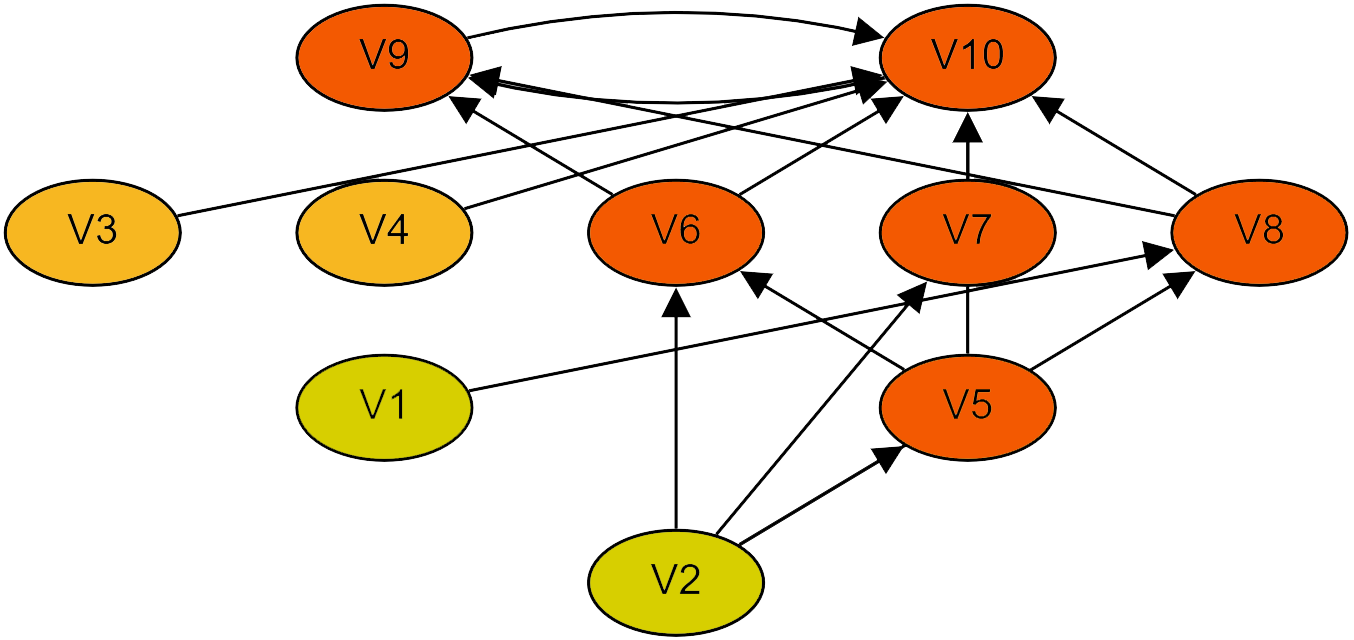
Figure 11. ISM Hierarchical Relationship Diagram
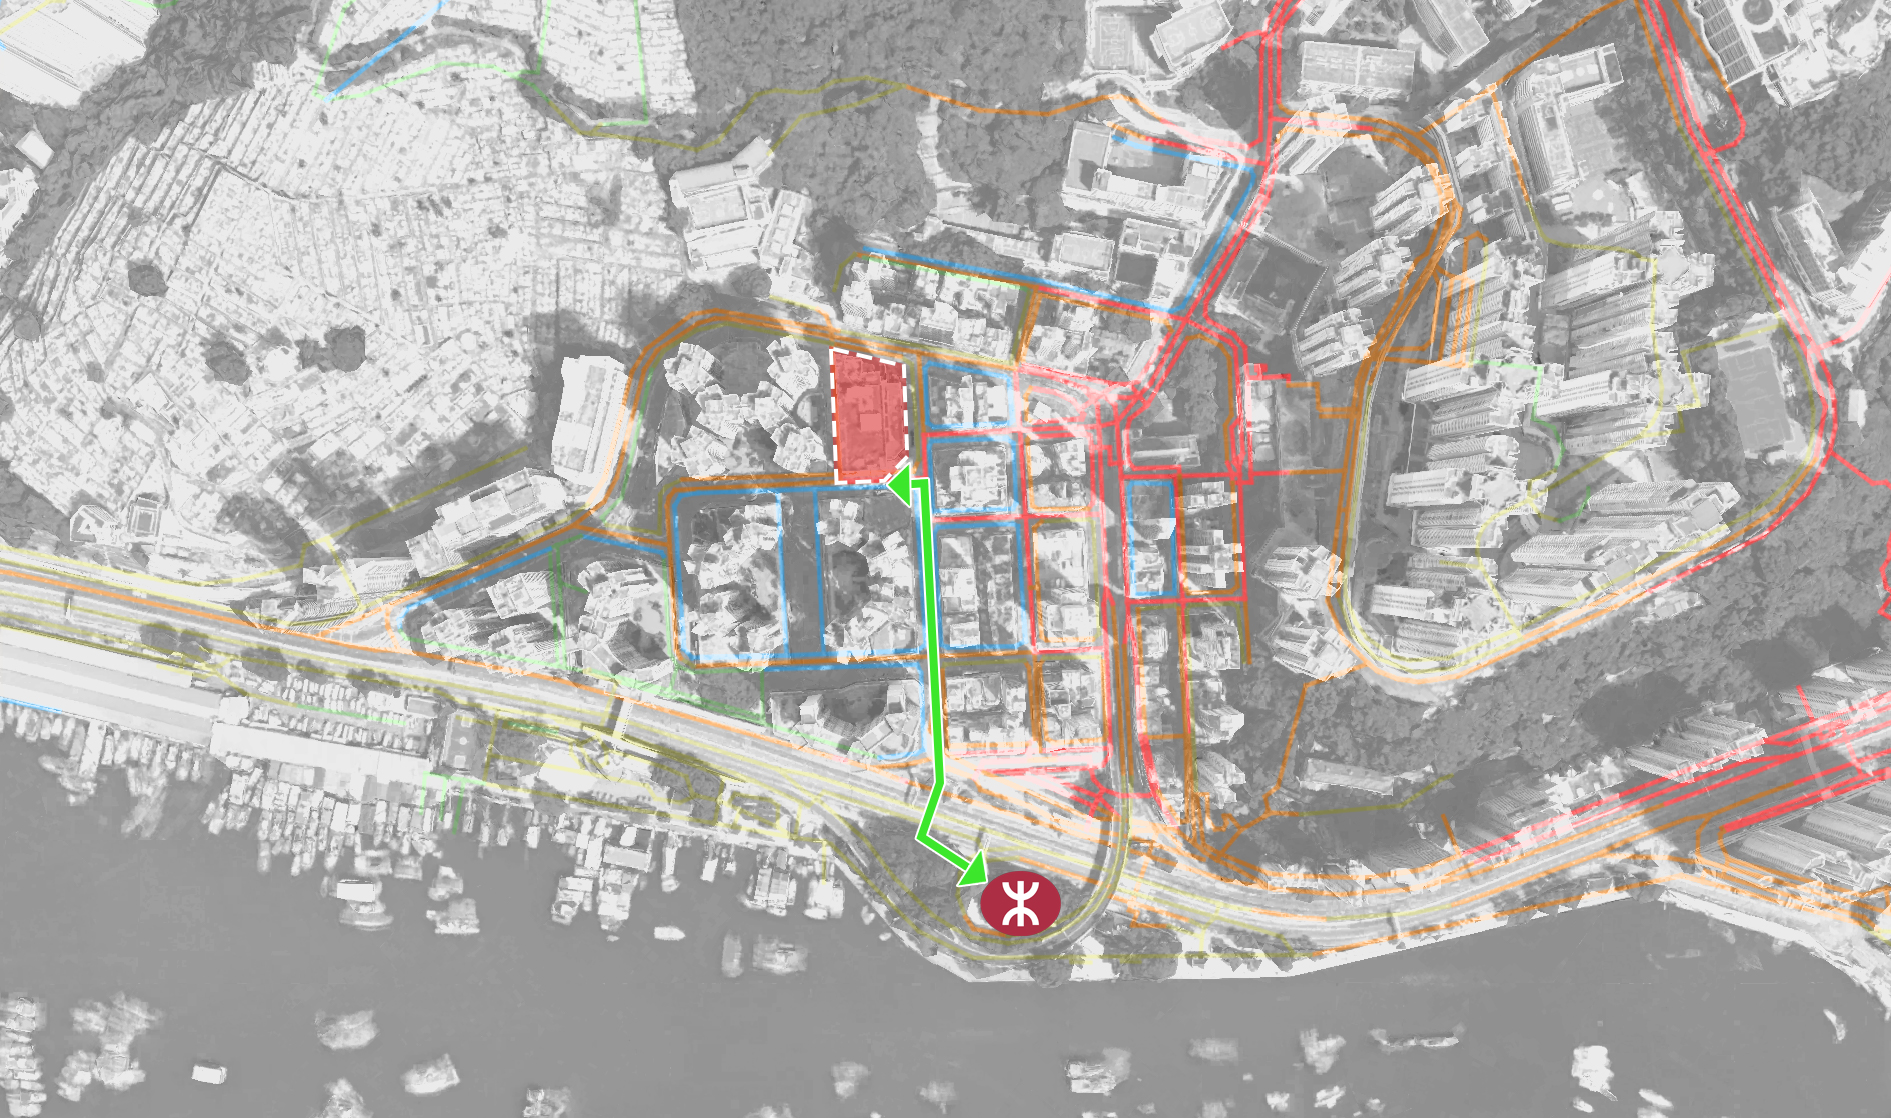
Figure 12. Future MTR Connection Between Aberdeen Market and Railway Station
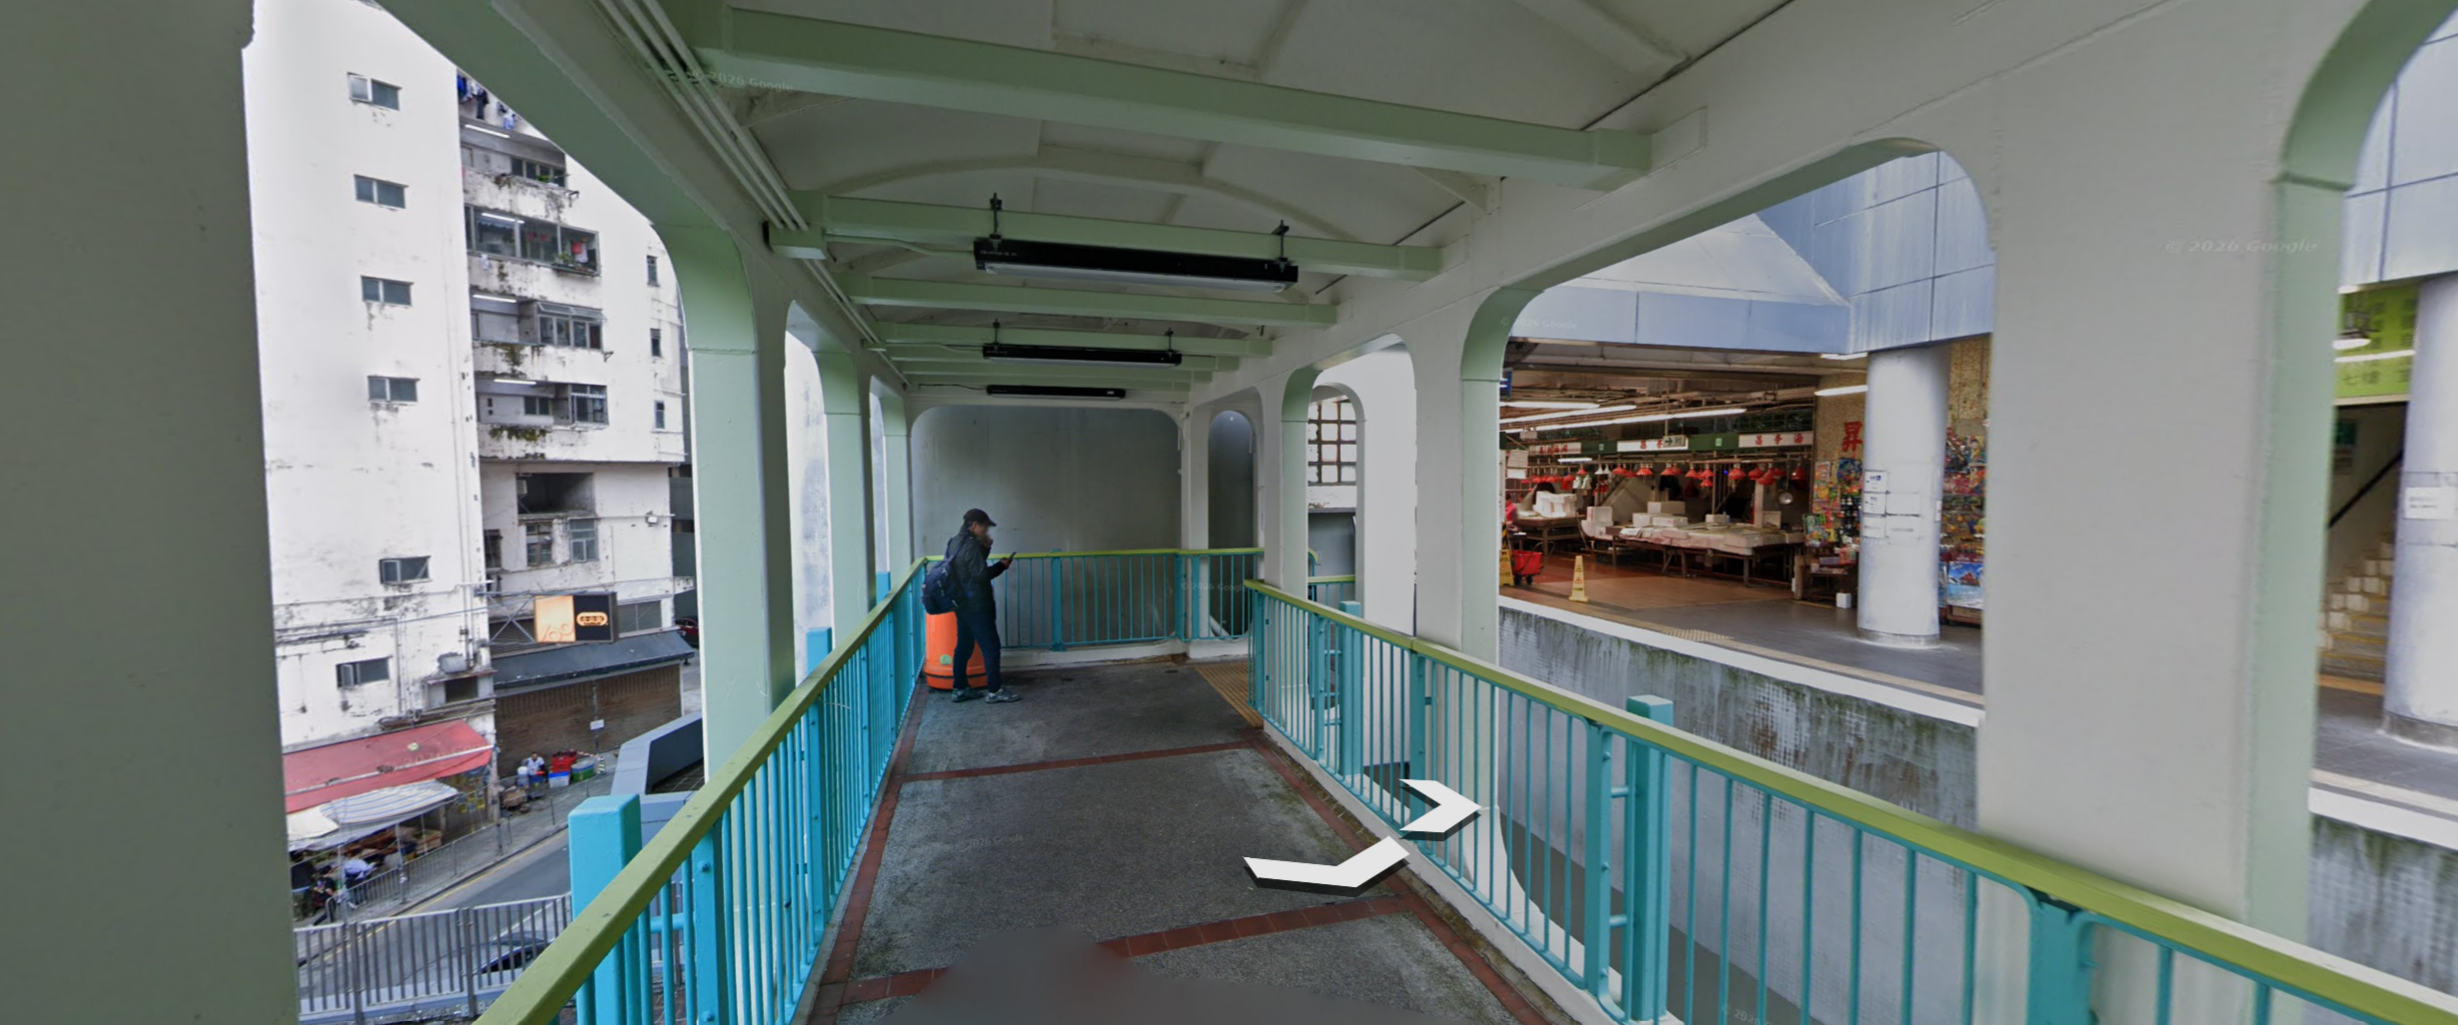
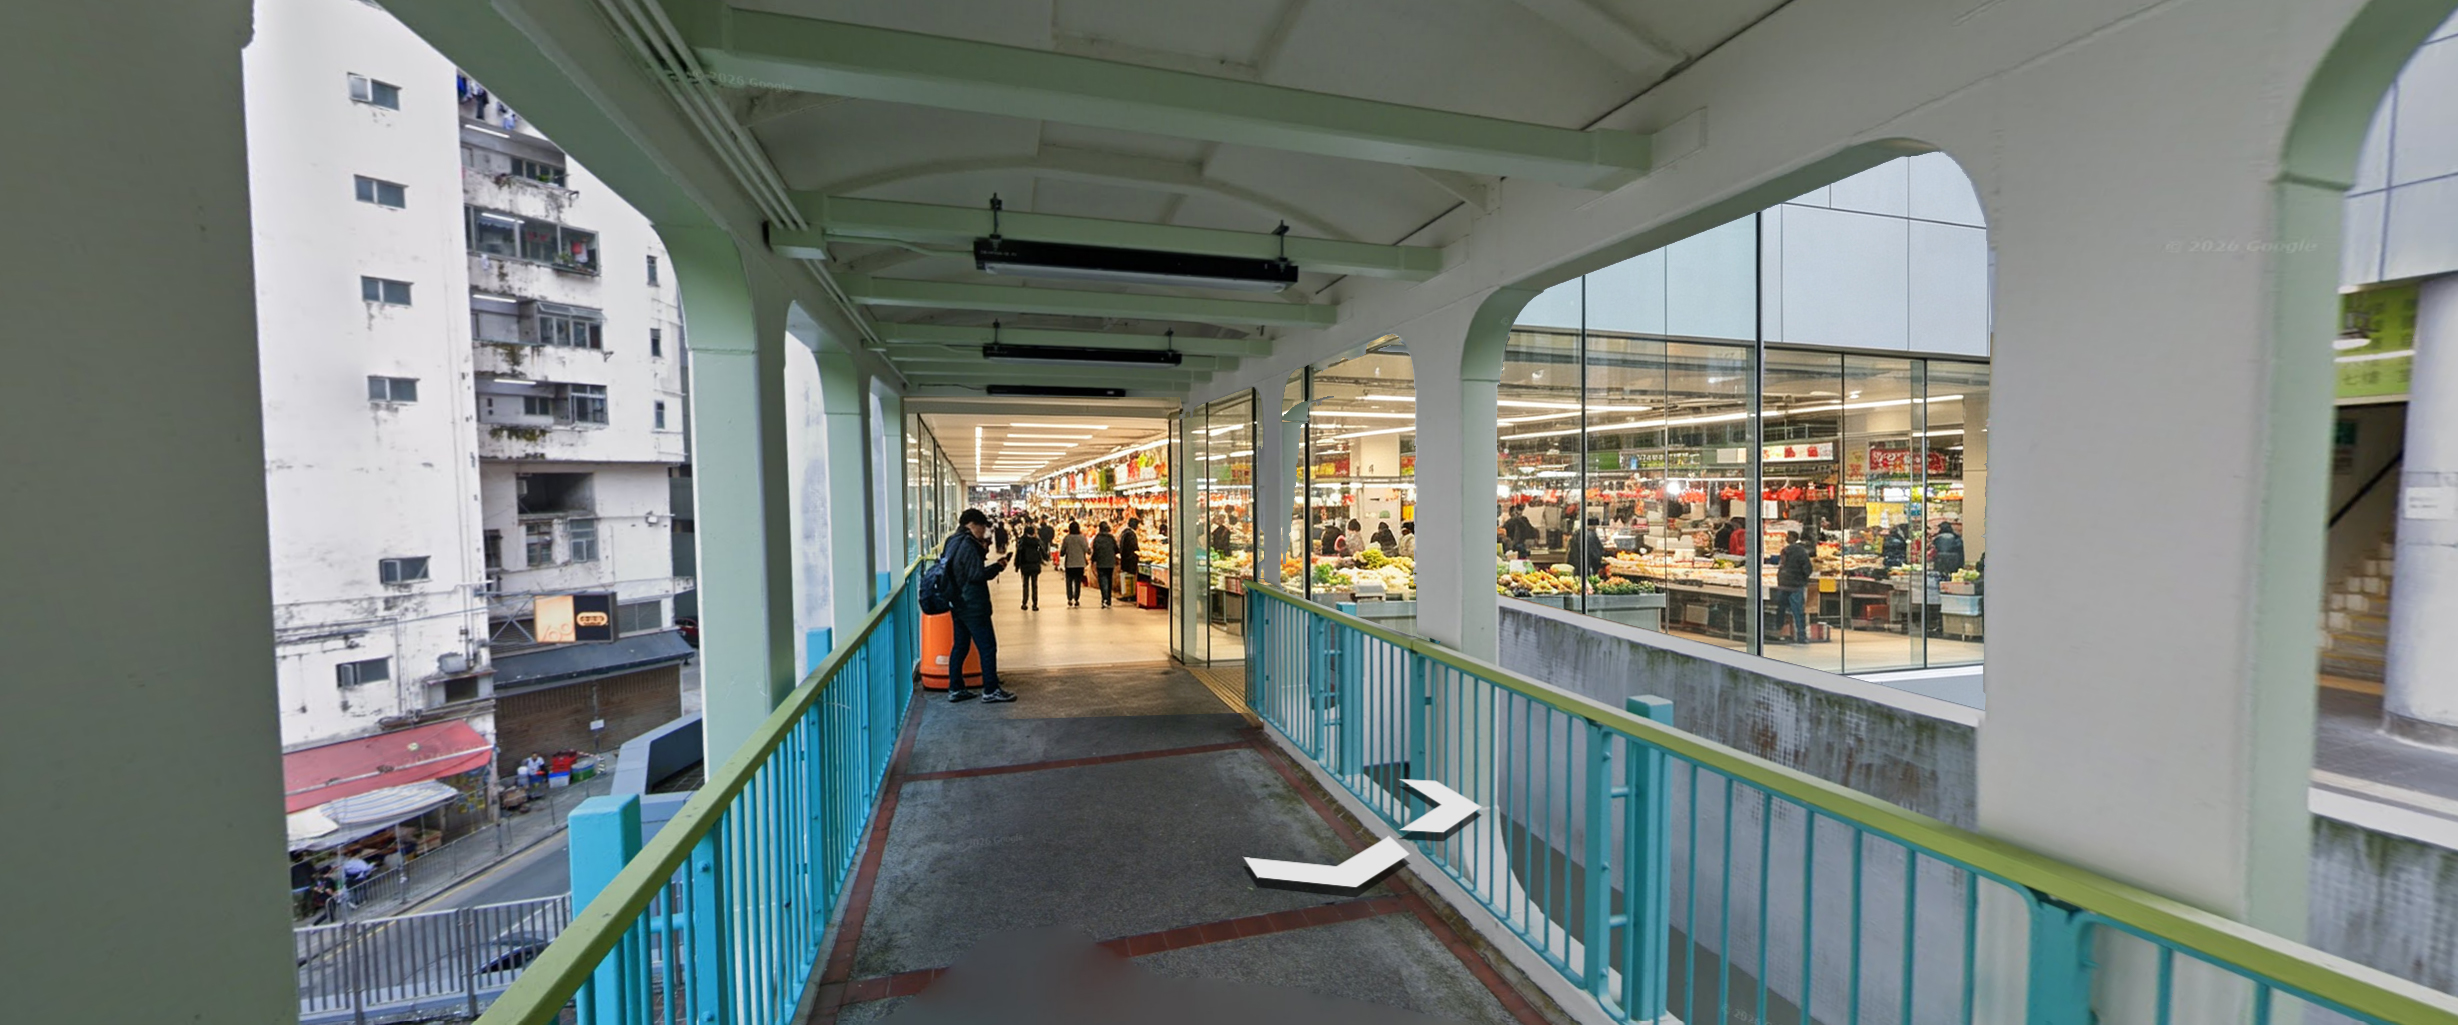
Figure 13. Comparison Diagram of Exterior Interface Renovation for Quarry Bay Market
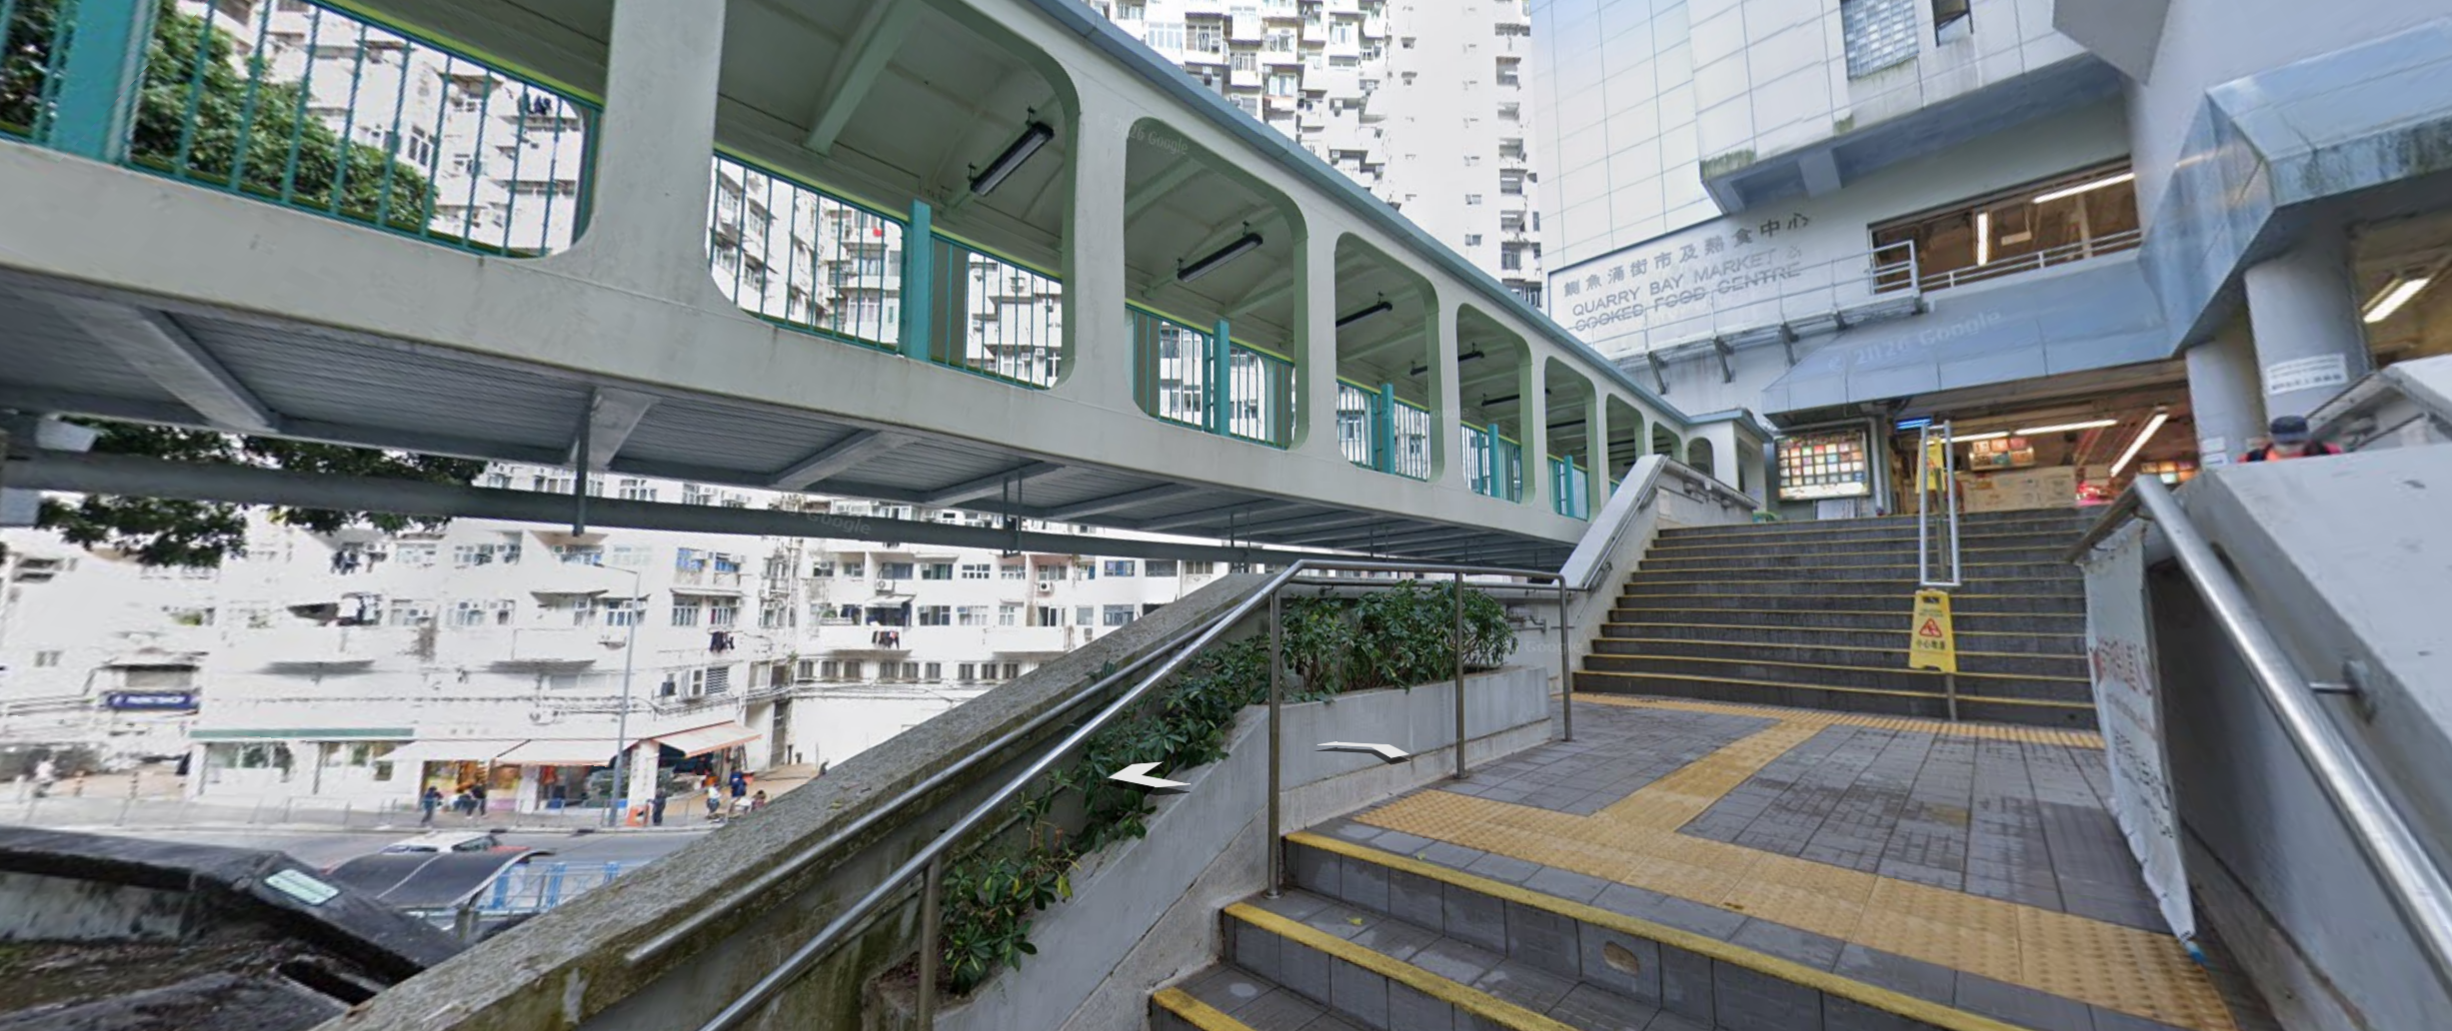
Figure 14. Comparison of Entrance and Vertical Circulation Renovation at Quarry Bay Market
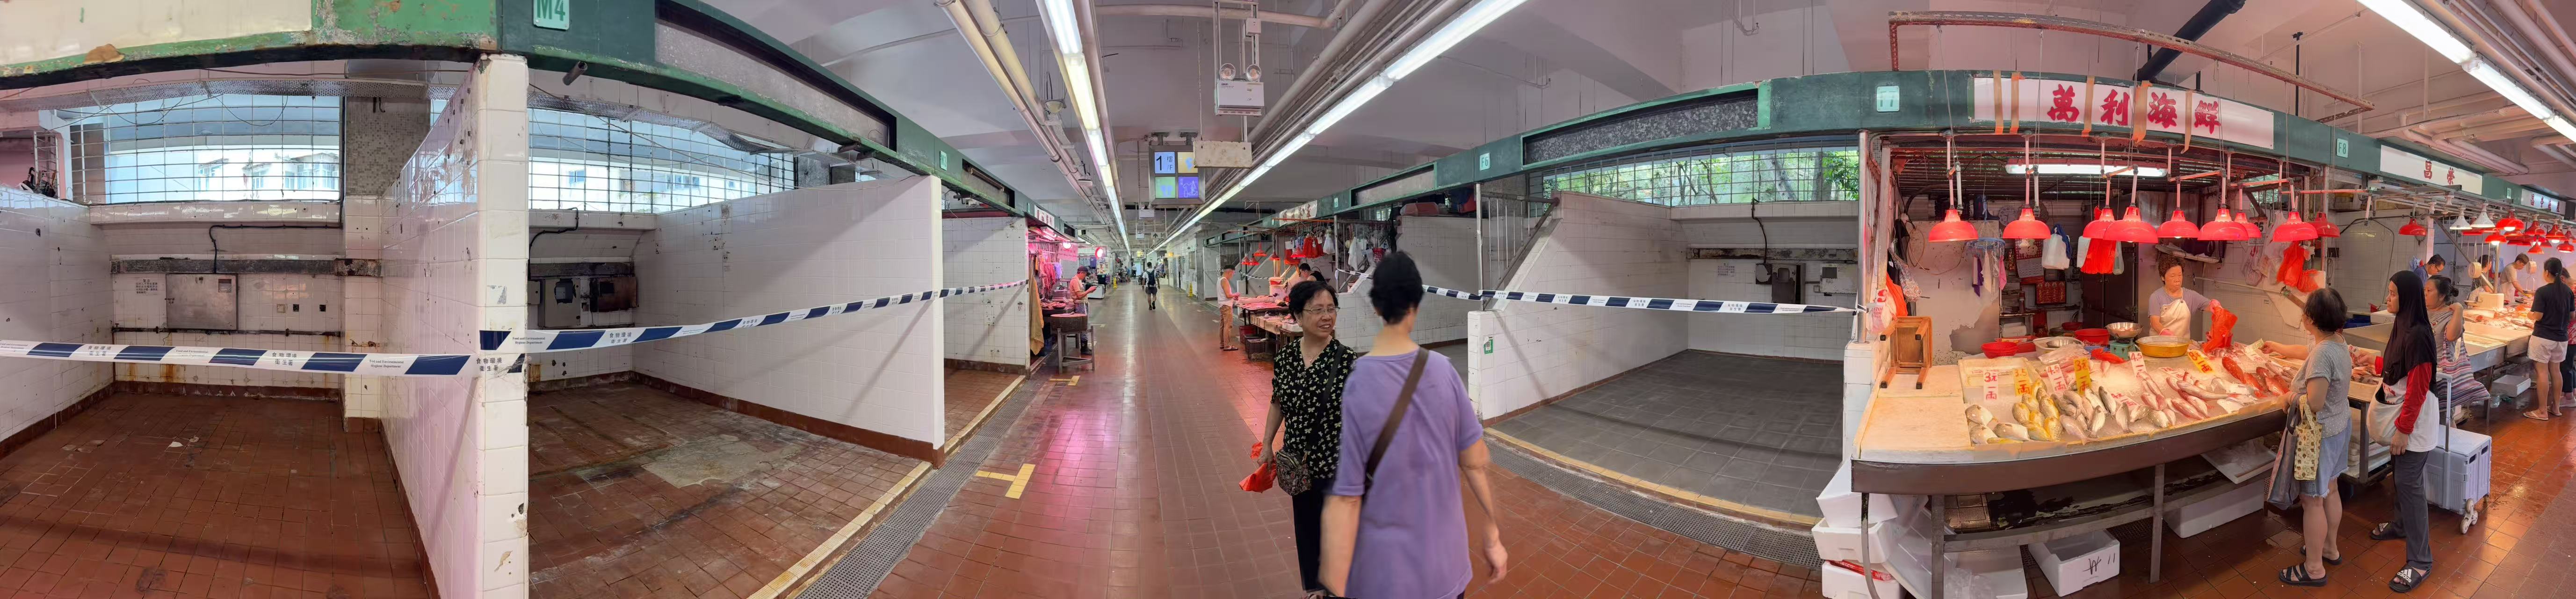
Figure 15a. Comparison of Modular Adaptive Layout Renovation Inside Quarry Bay Market, Before Renovation
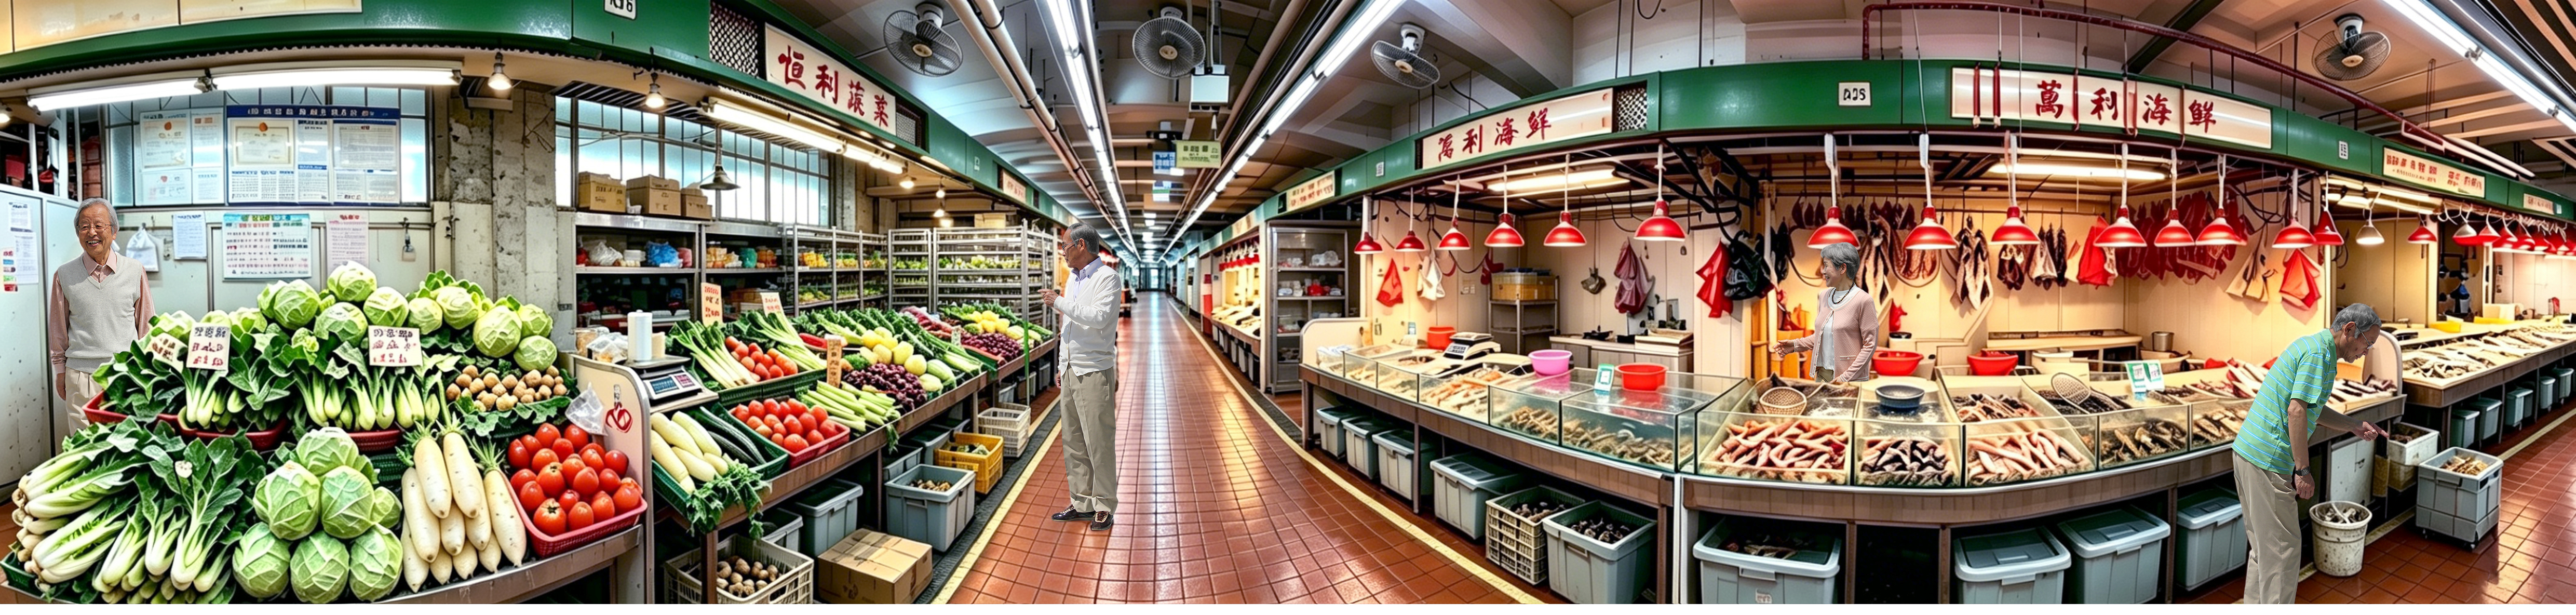
Figure 15b. Comparison of Modular Adaptive Layout Renovation Inside Quarry Bay Market, After Removing Prefabricated Panels to Merge Adjacent Stalls
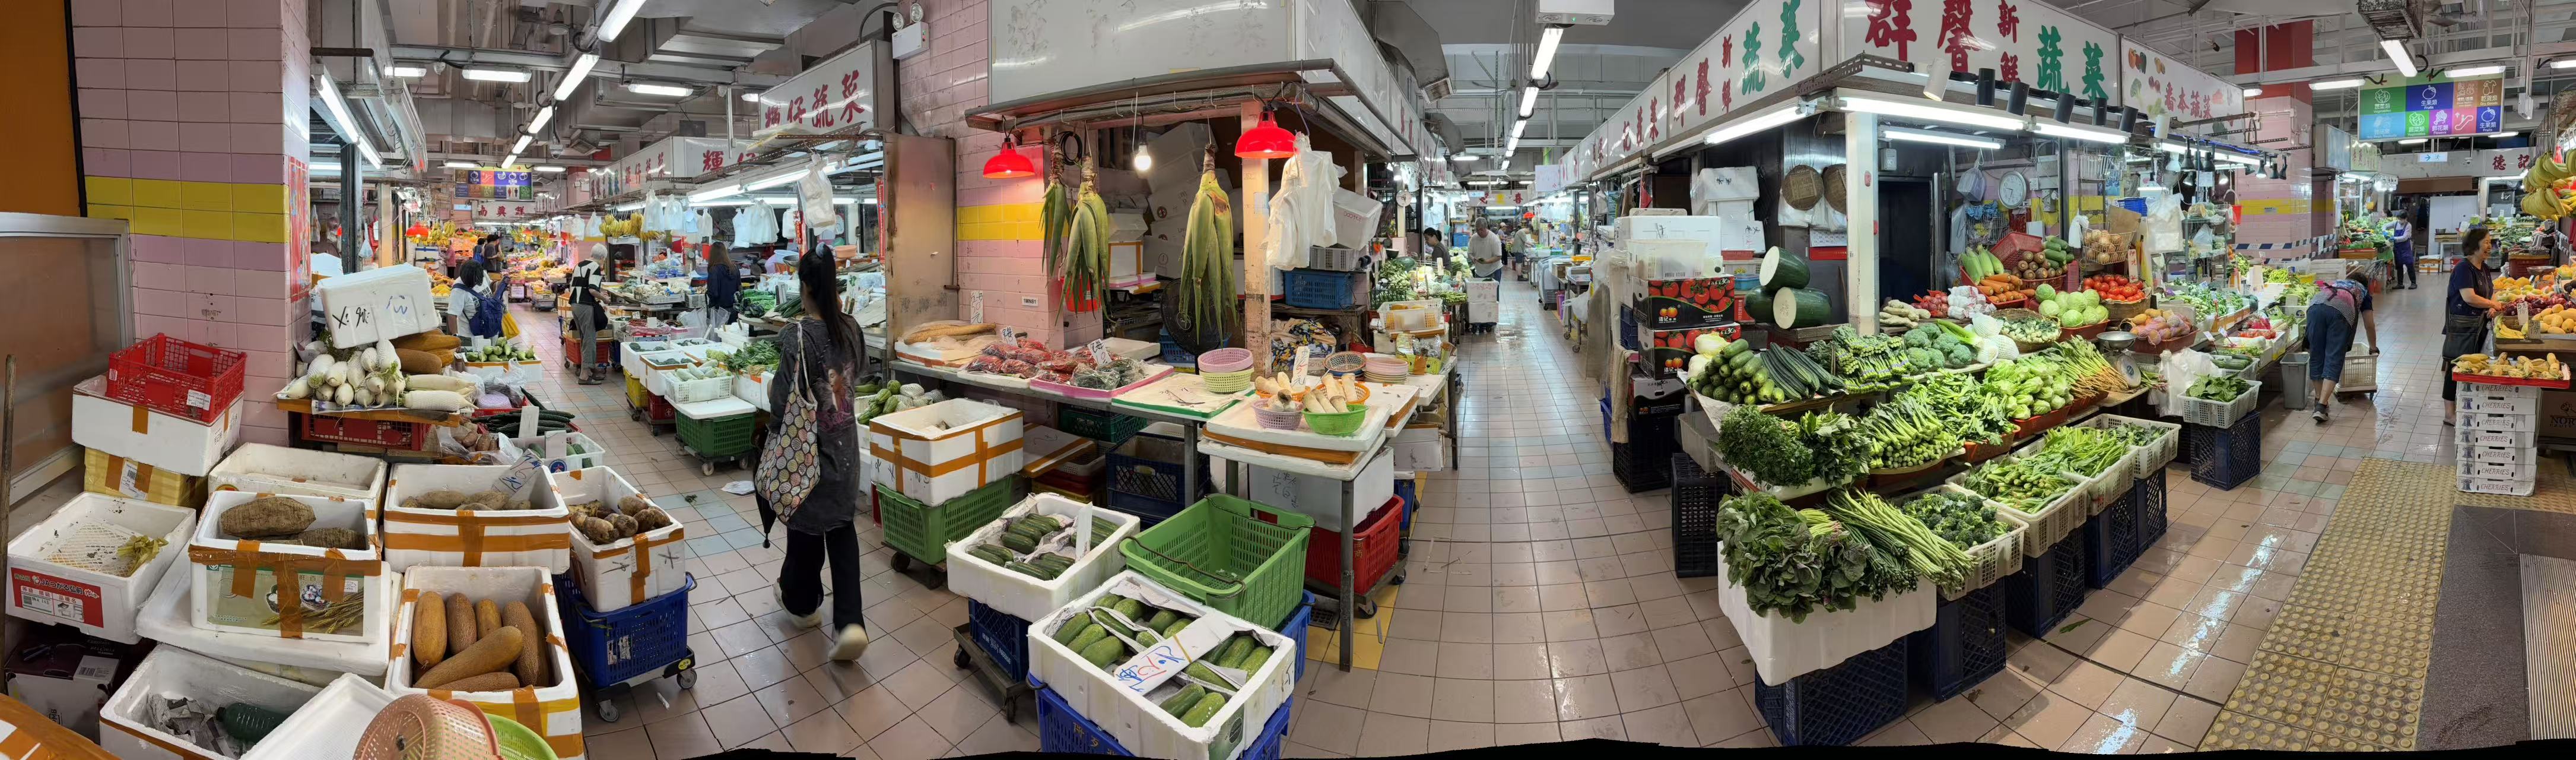
Figure 16a. Before-and-After Comparison of Time-Shared Sorting Buffer Zones in Smithfield Market, Before Renovation
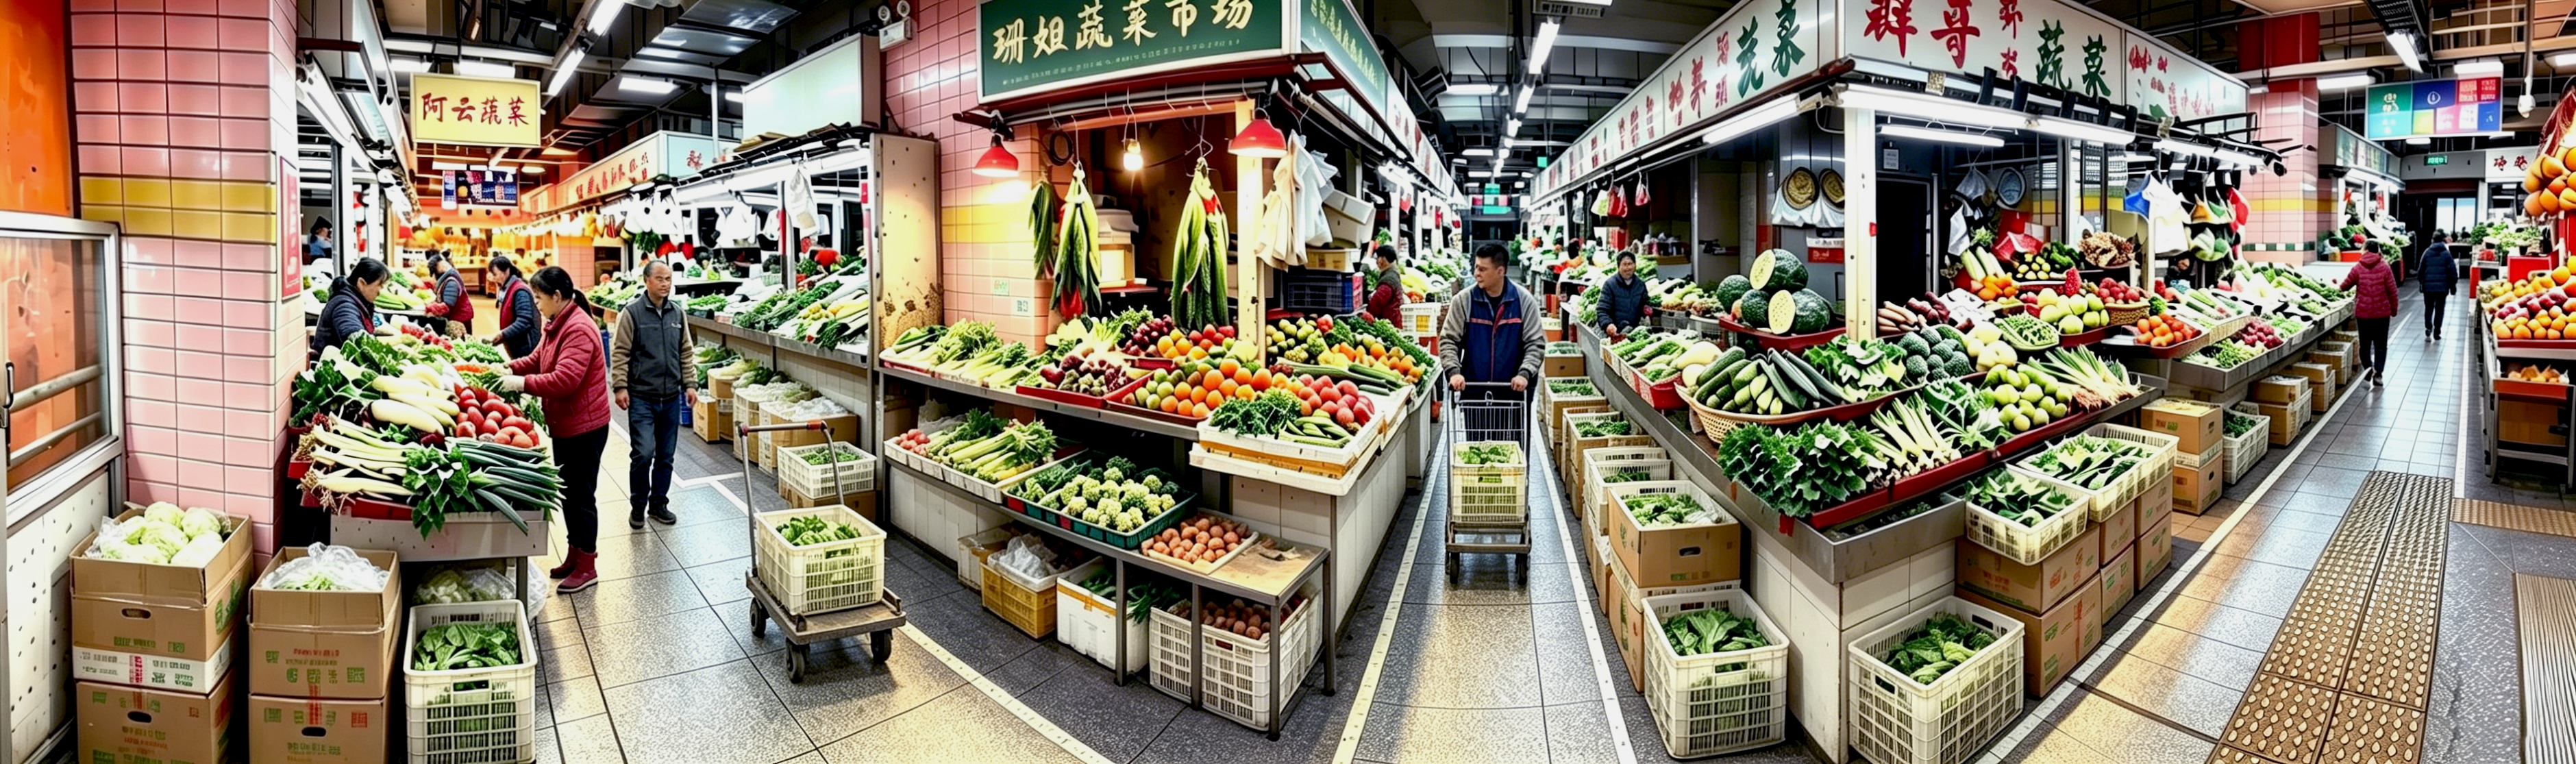
Figure 16b. Comparison of Garbage Collection Point Renovation in Quarry Bay Market, During Designated Sorting Periods

Figure 16c. Comparison of Garbage Collection Point Renovation in Quarry Bay Market, During Regular Business Periods
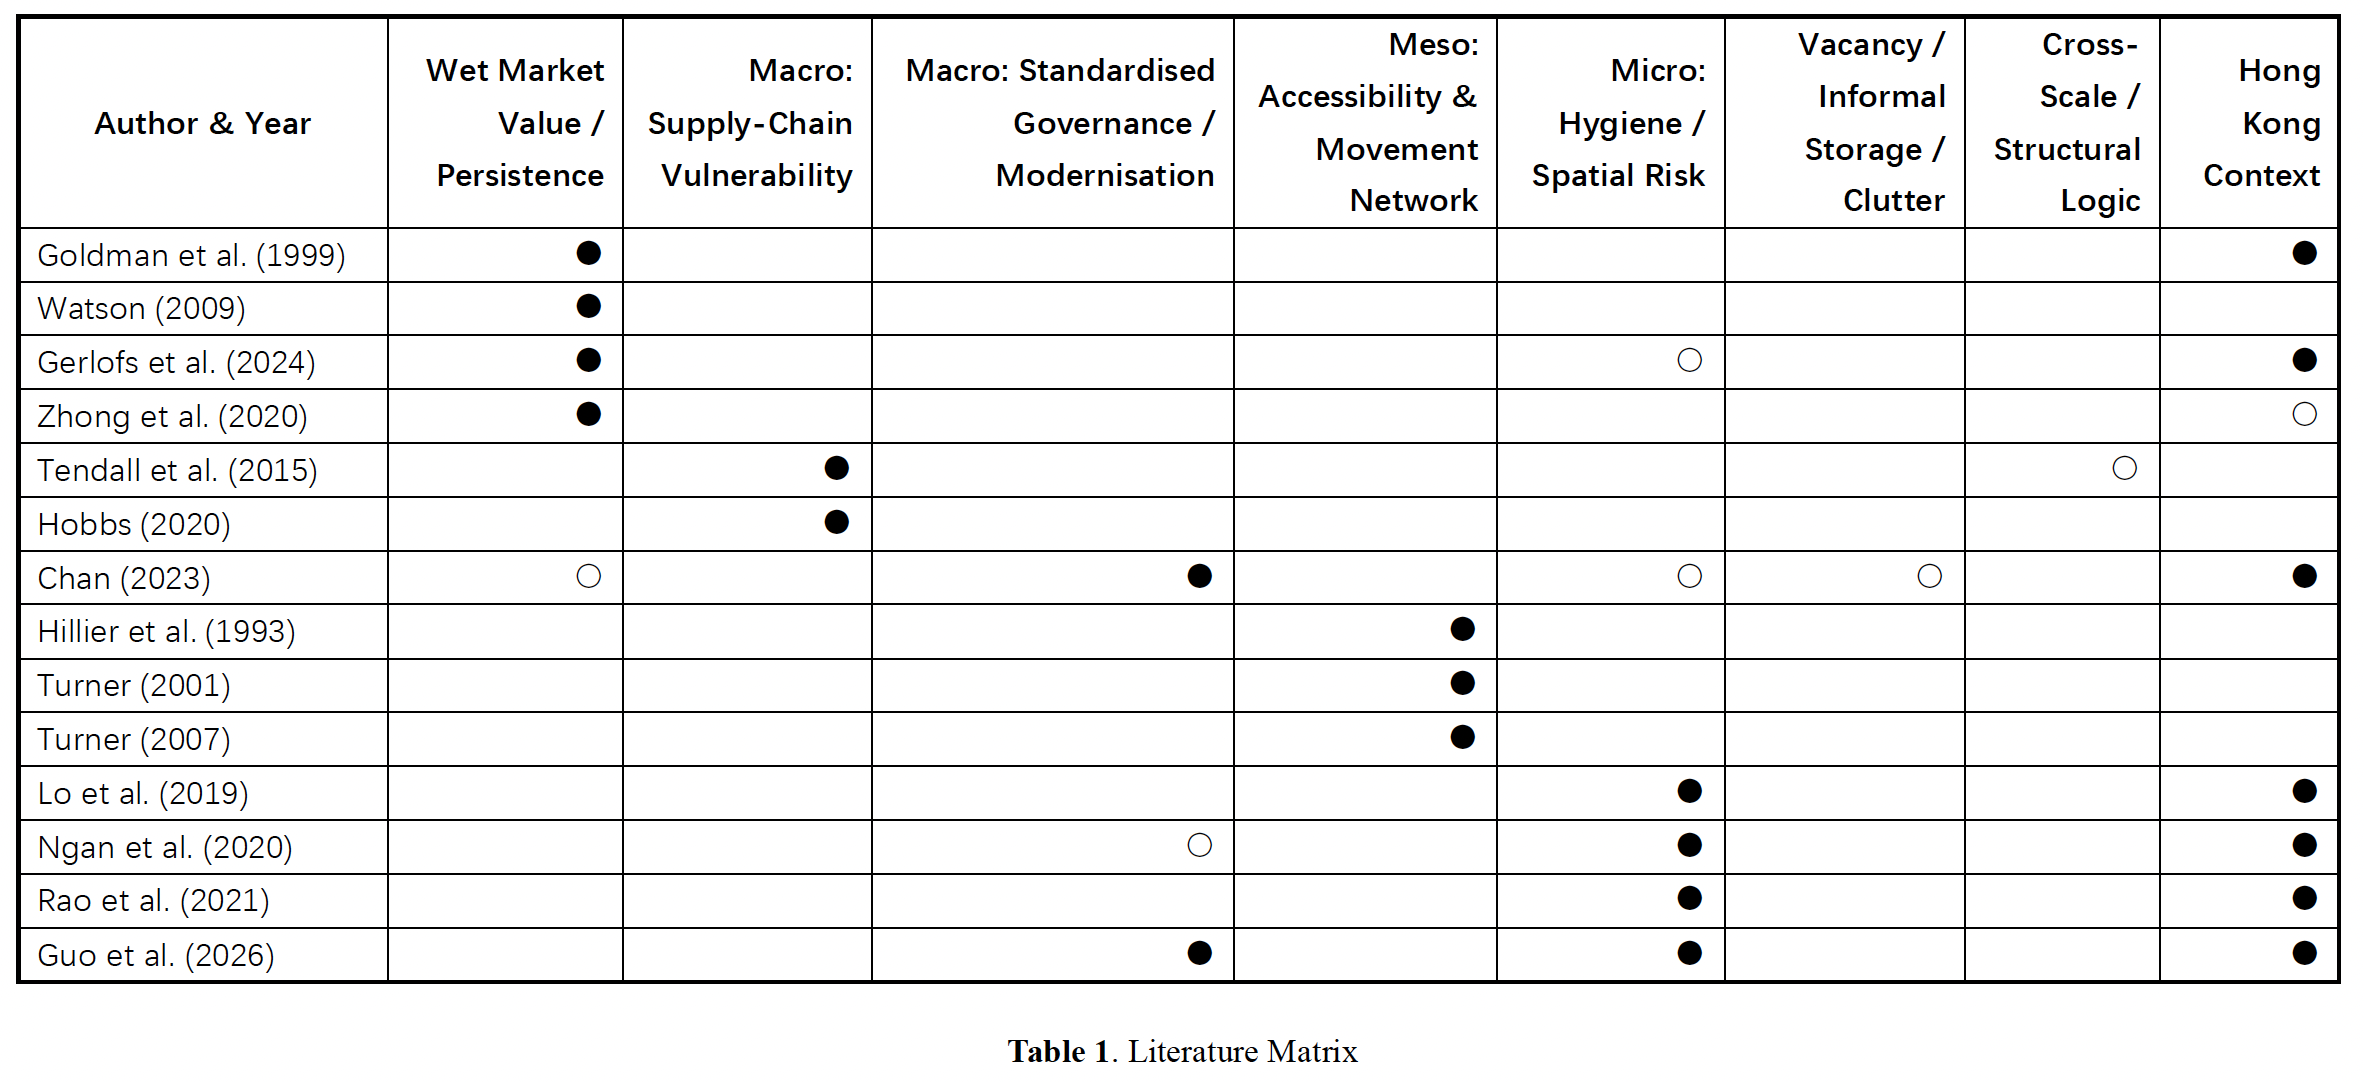
Table 1. Literature Matrix
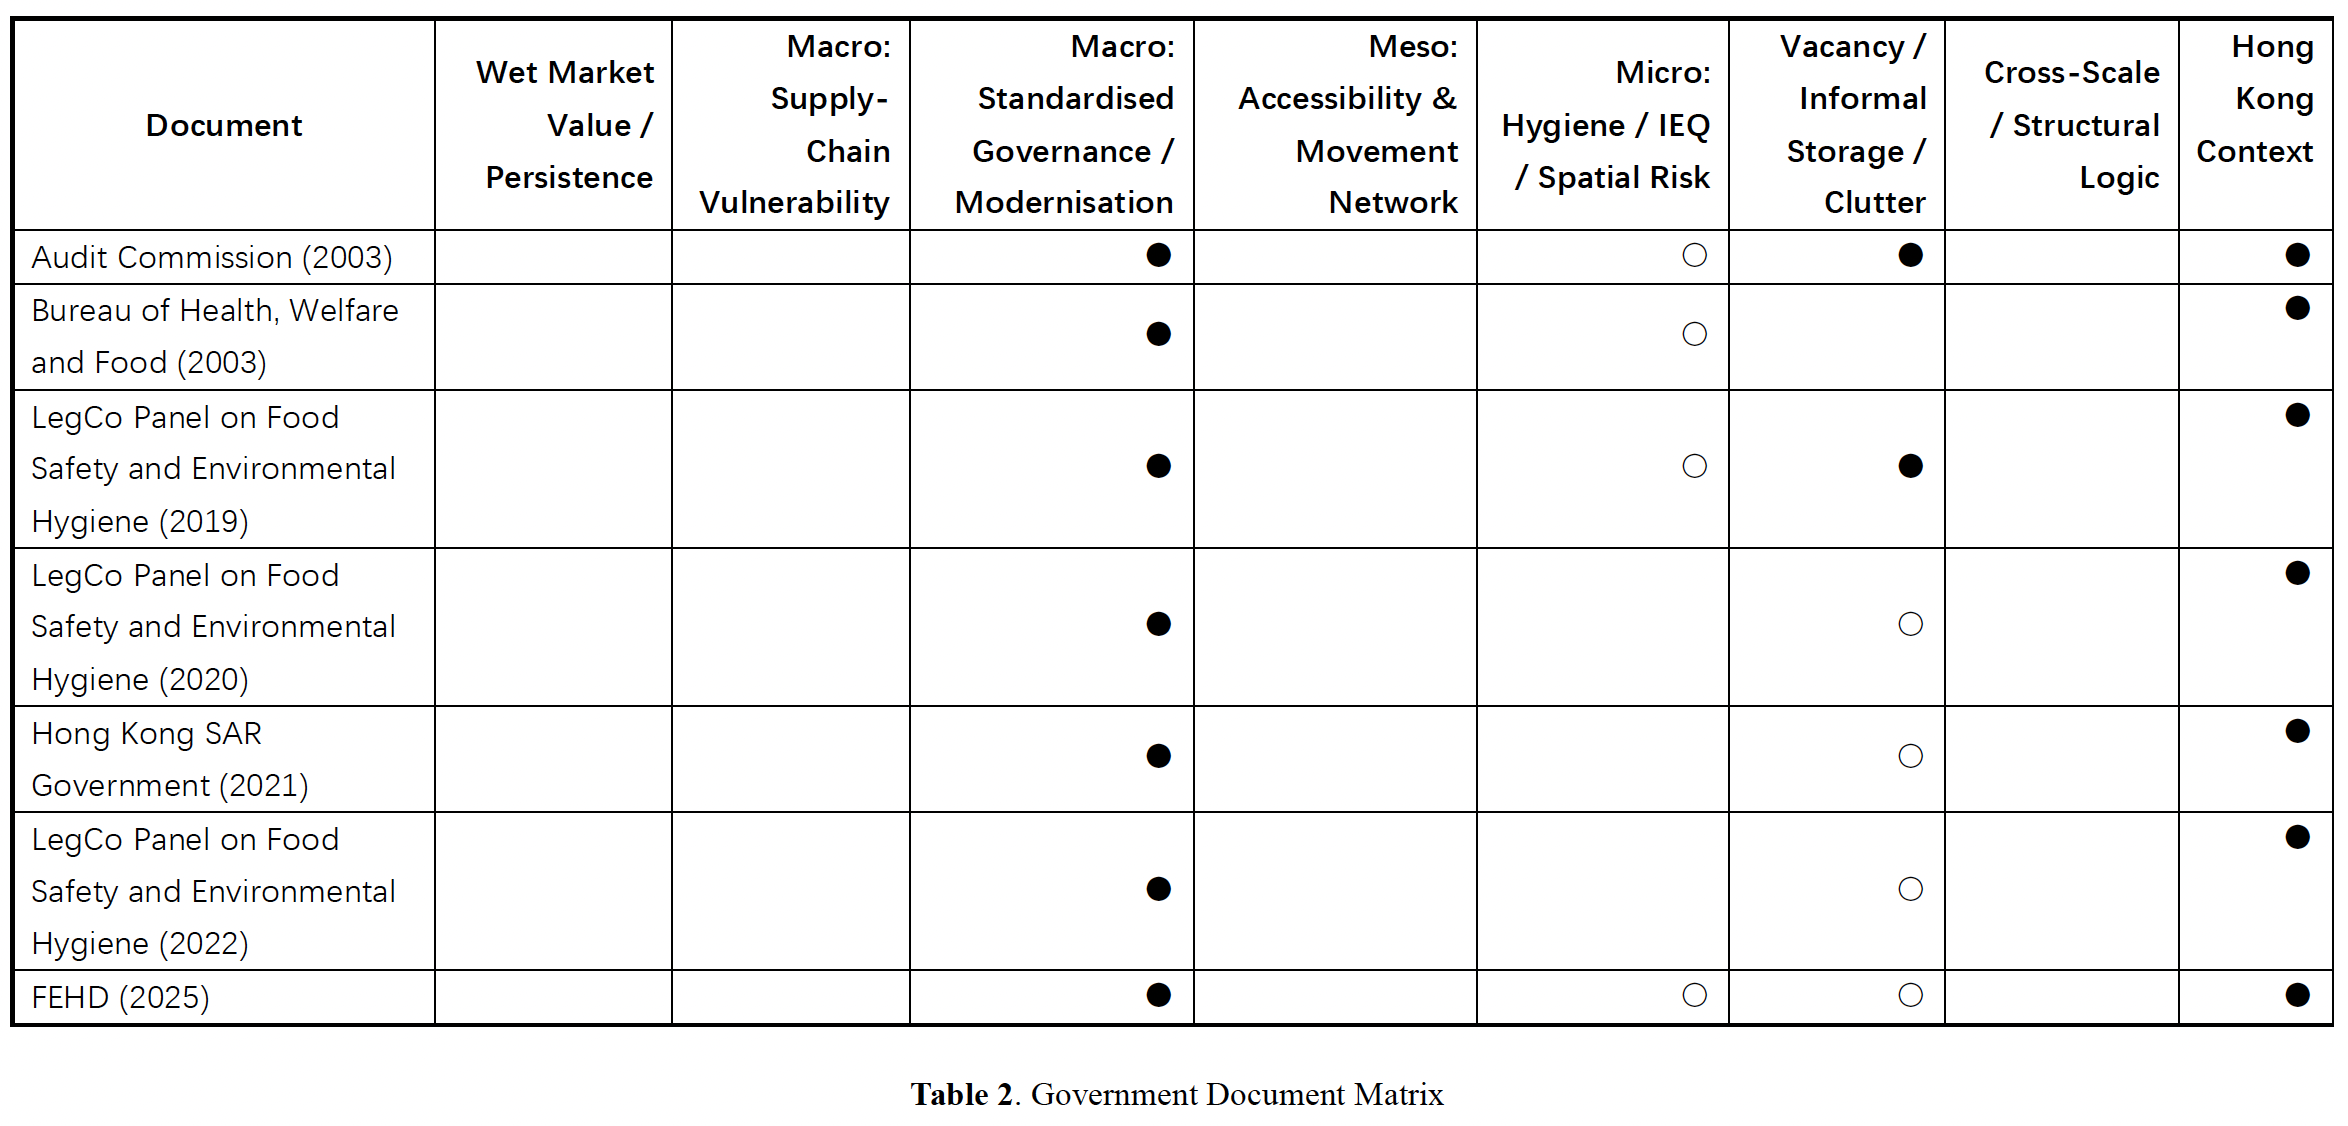
Table 2. Government Document Matrix
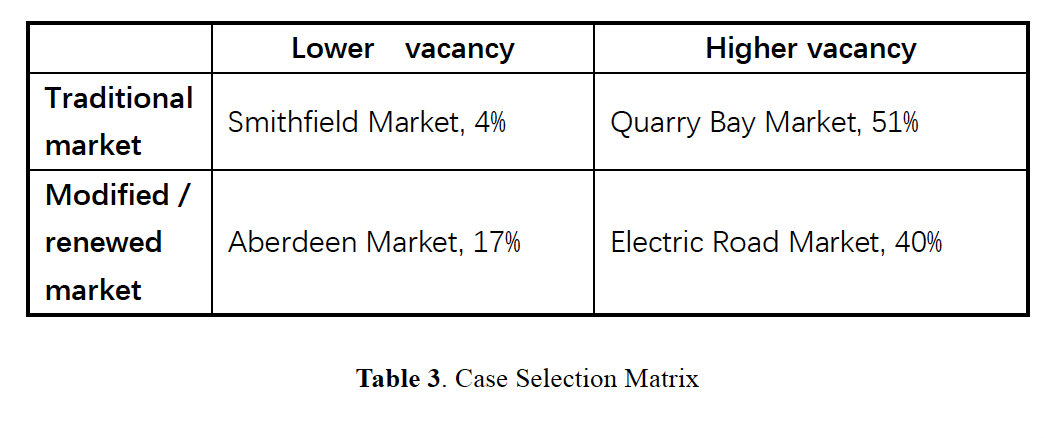
Table 3. Case Selection Matrix
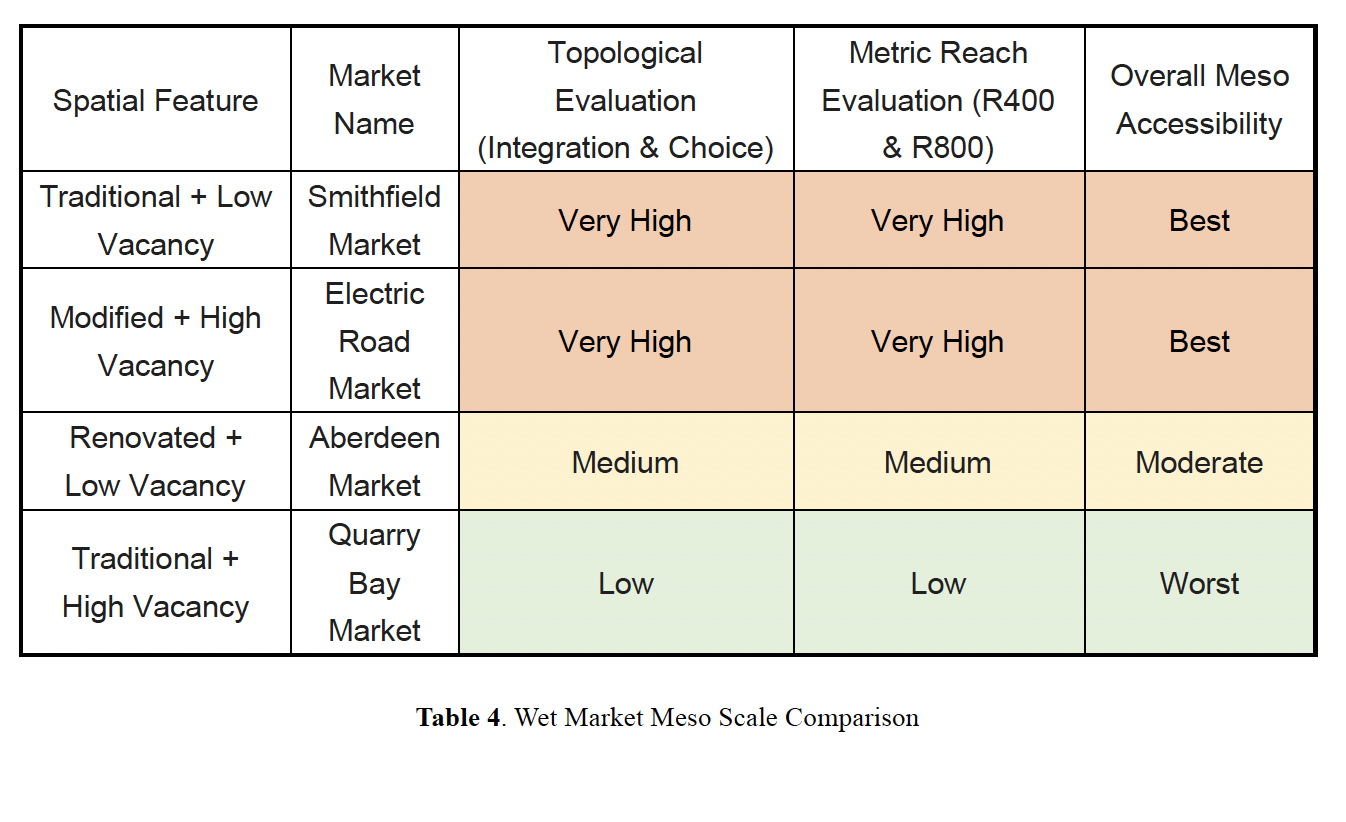
Table 4. Wet Market Meso Scale Comparison
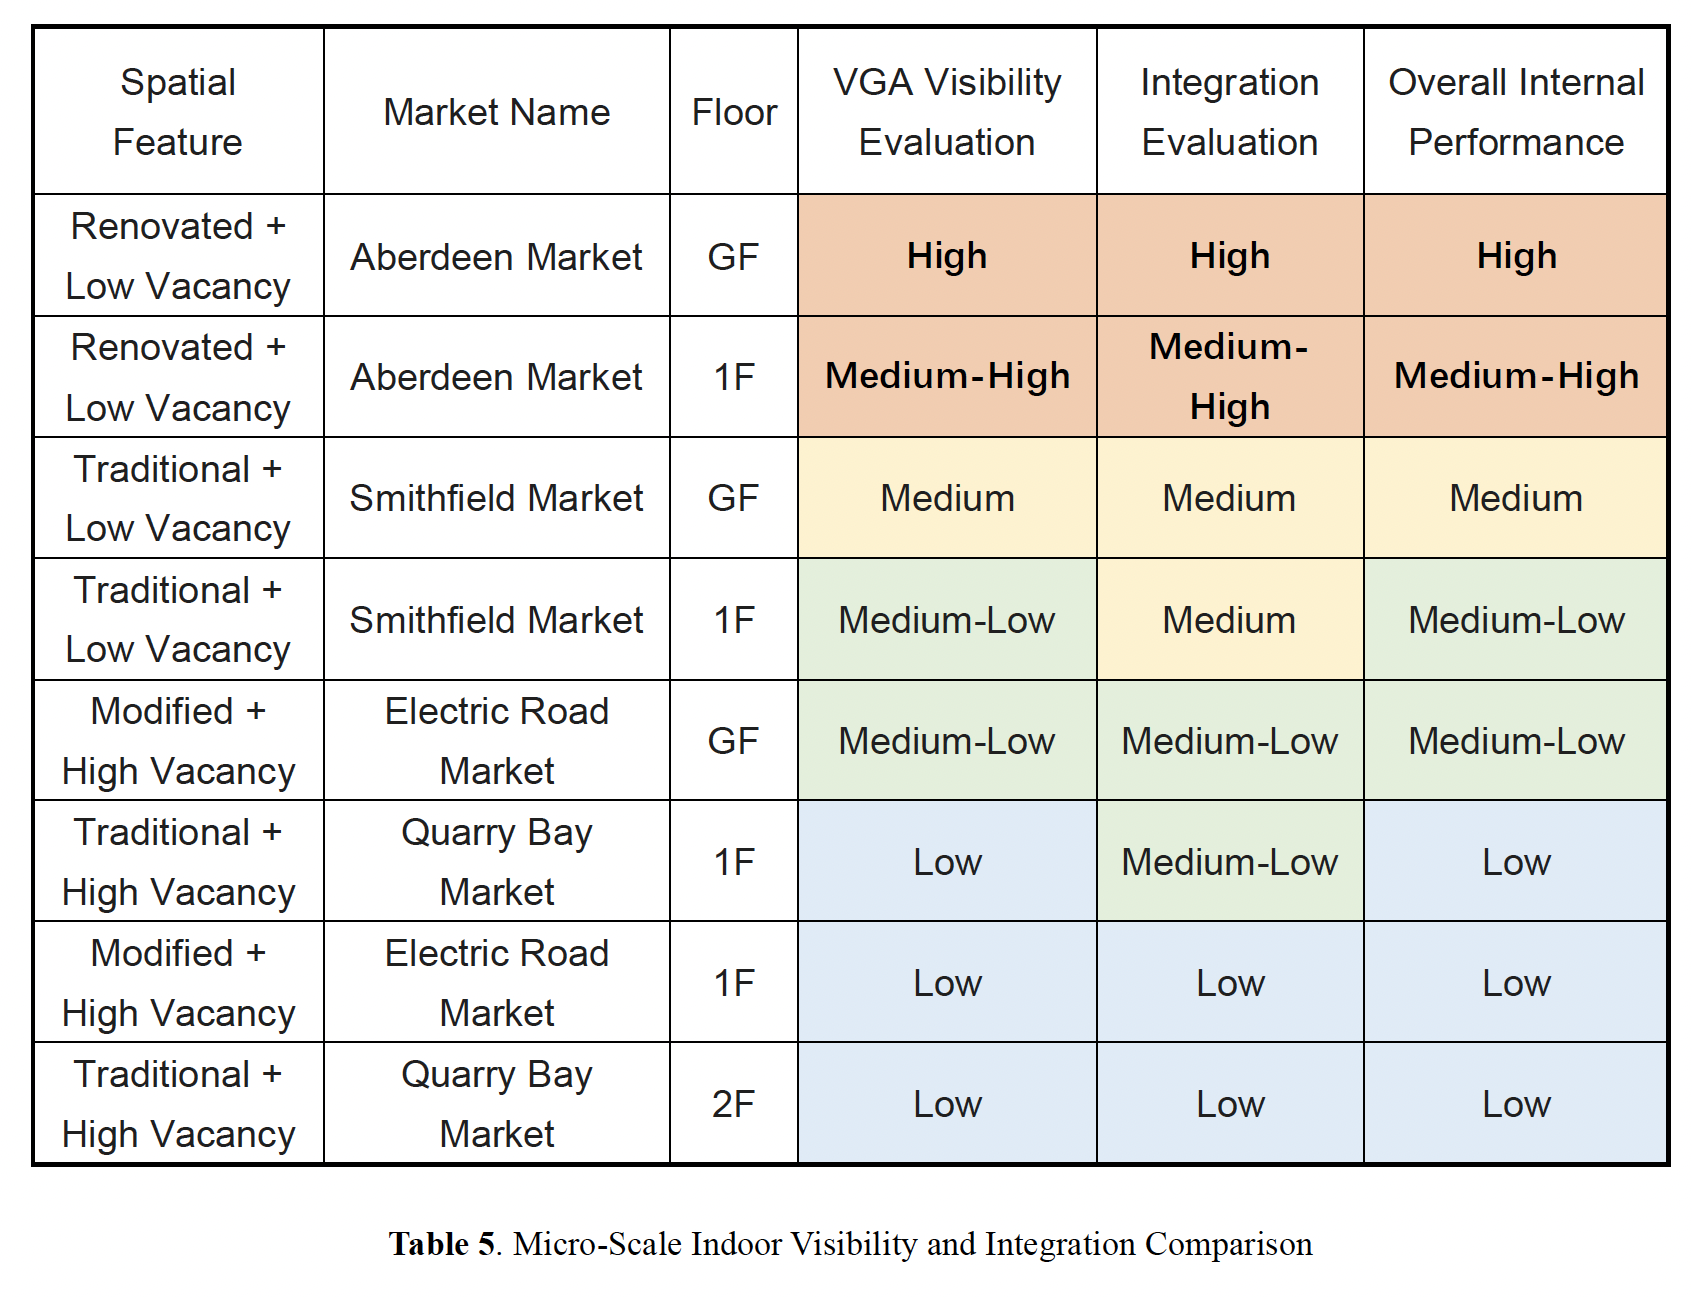
Table 5. Micro-Scale Indoor Visibility and Integration Comparison
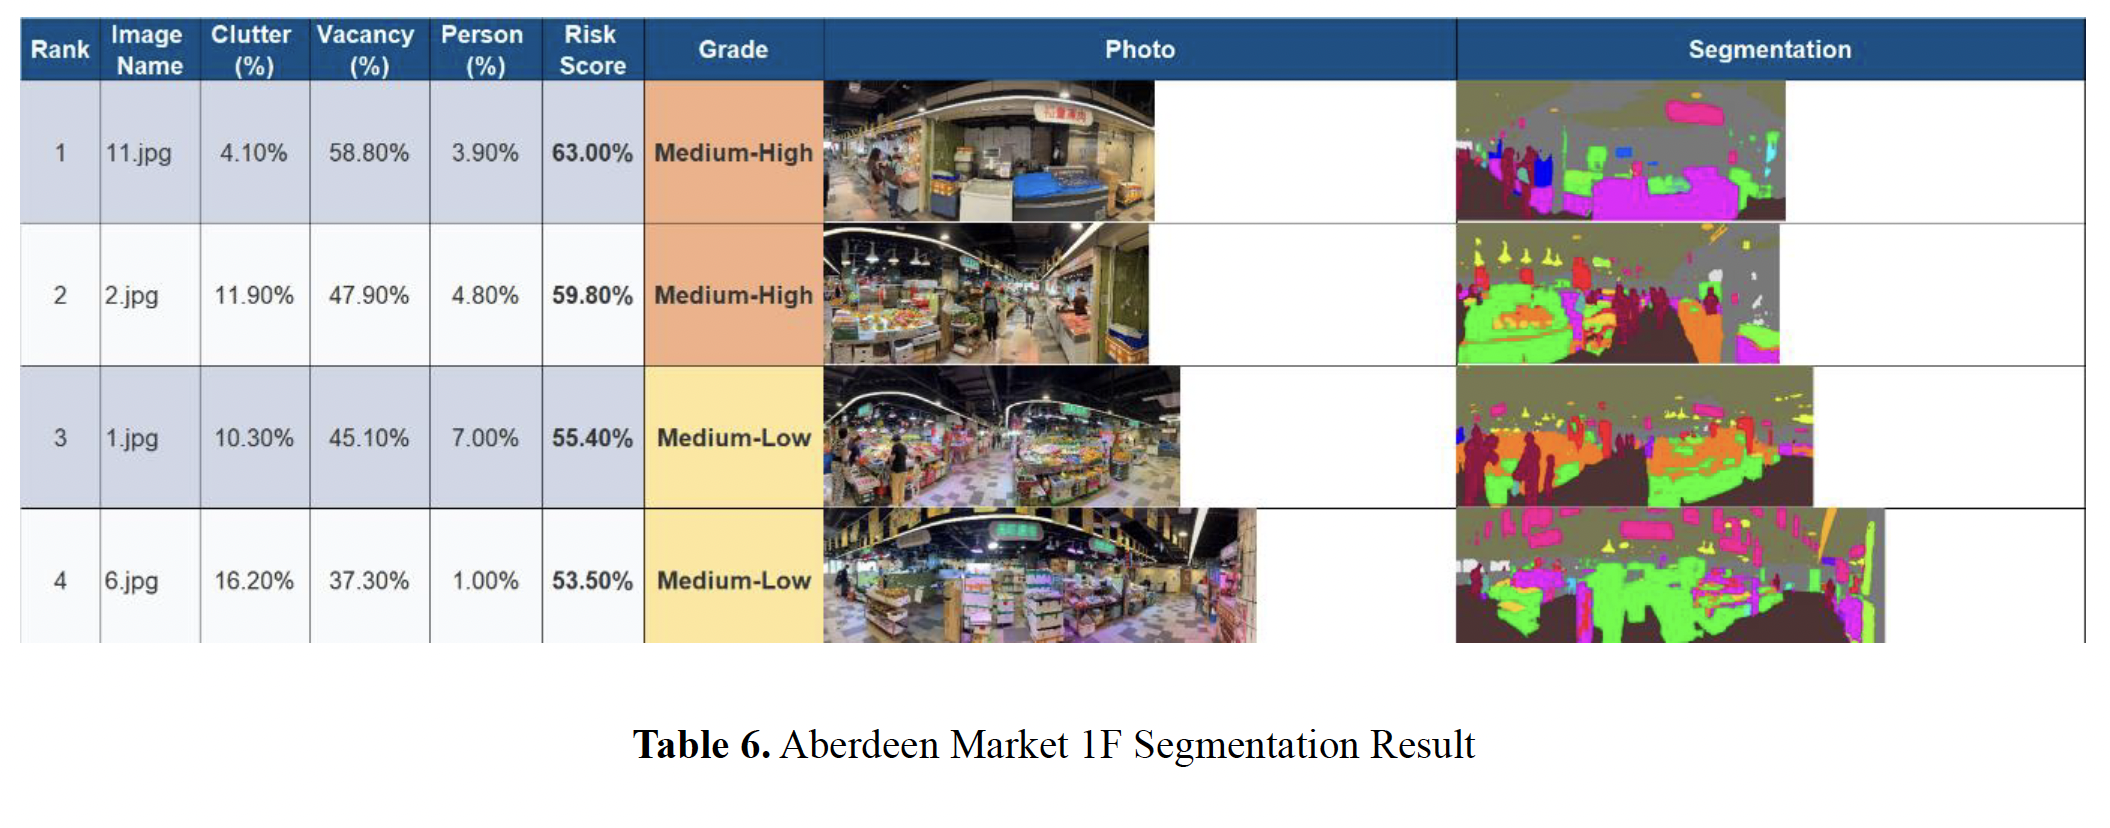
Table 6. Aberdeen Market 1F Segmentation Result
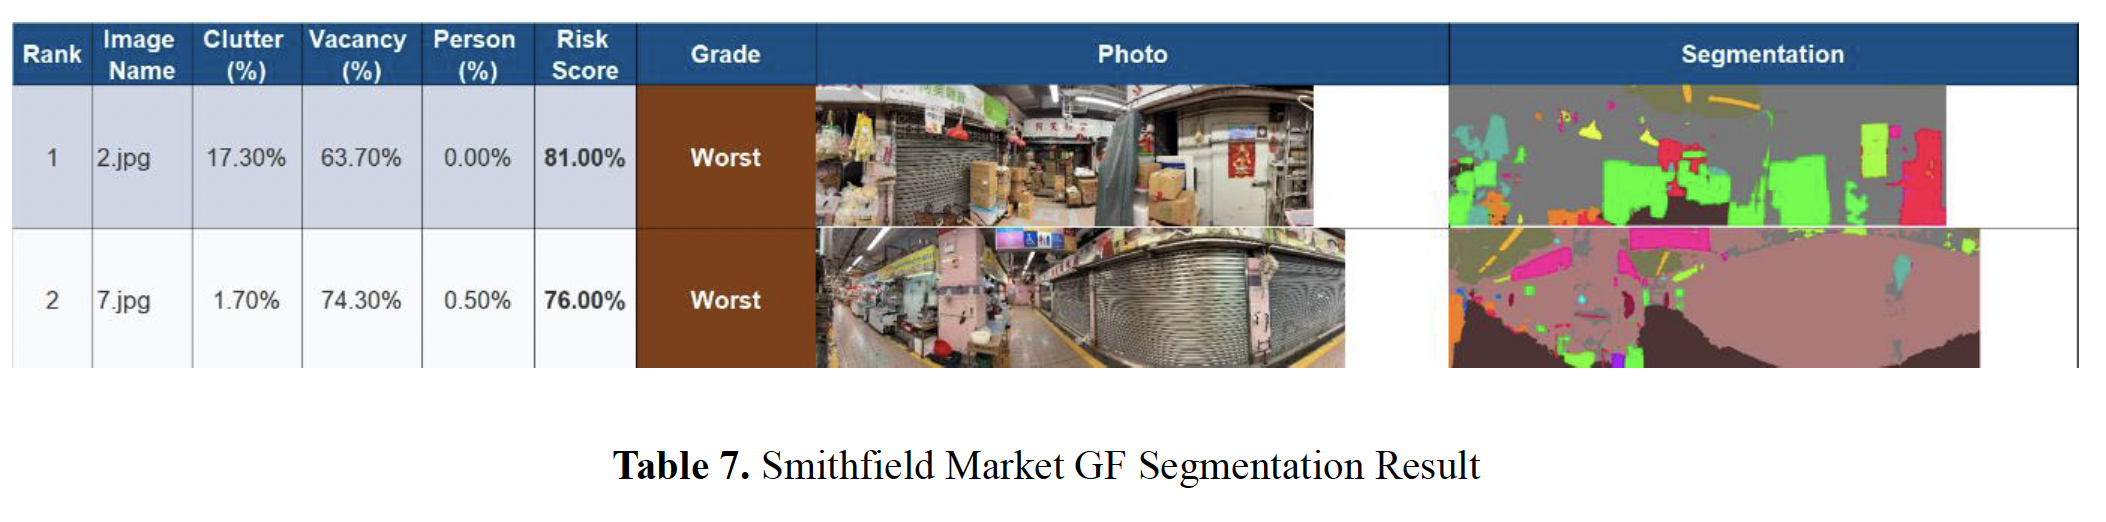
Table 7. Smithfield Market GF Segmentation Result

Table 8. Smithfield Market 1F Segmentation Result
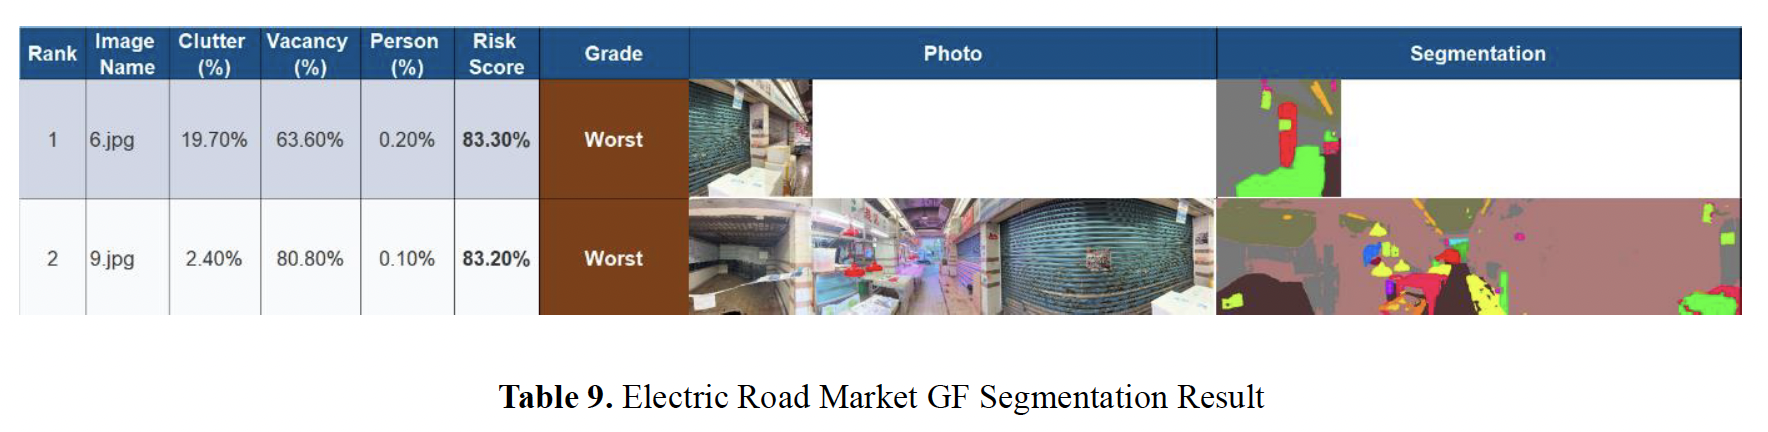
Table 9. Electric Road Market GF Segmentation Result
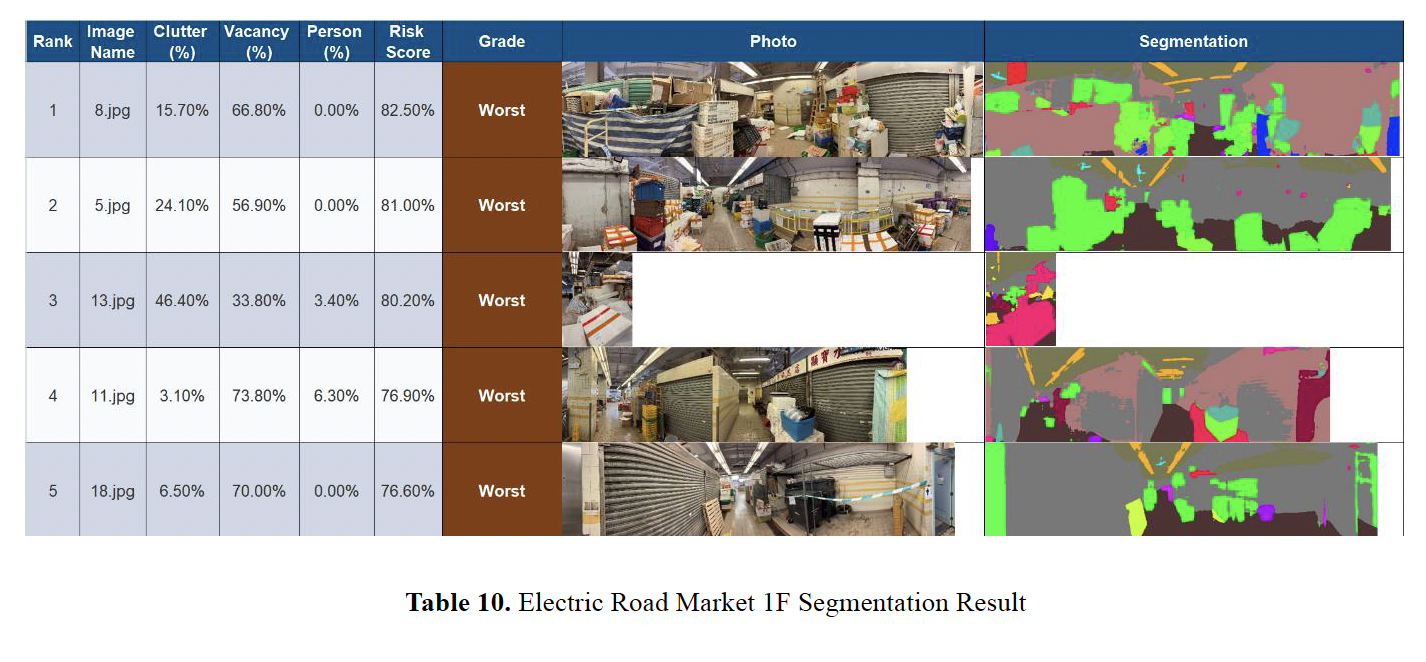
Table 10. Electric Road Market 1F Segmentation Result
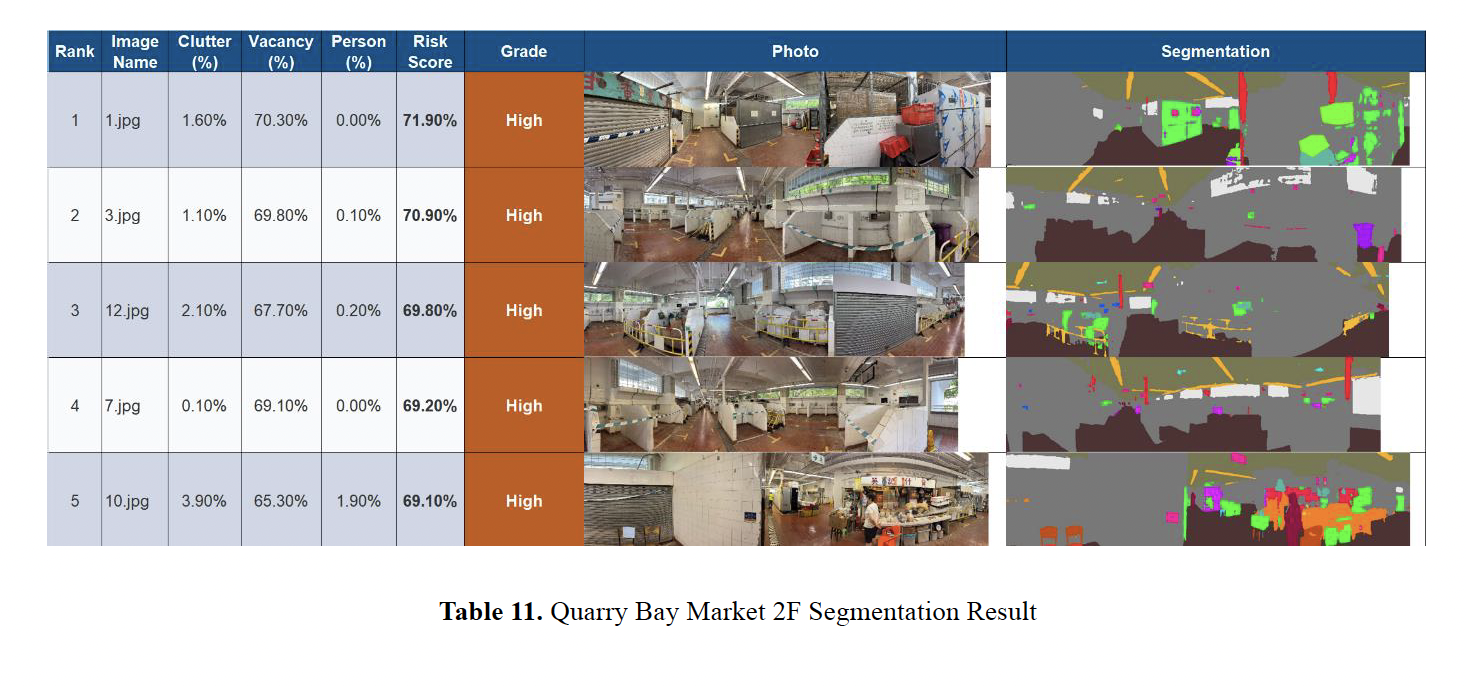
Table 11. Quarry Bay Market 2F Segmentation Result
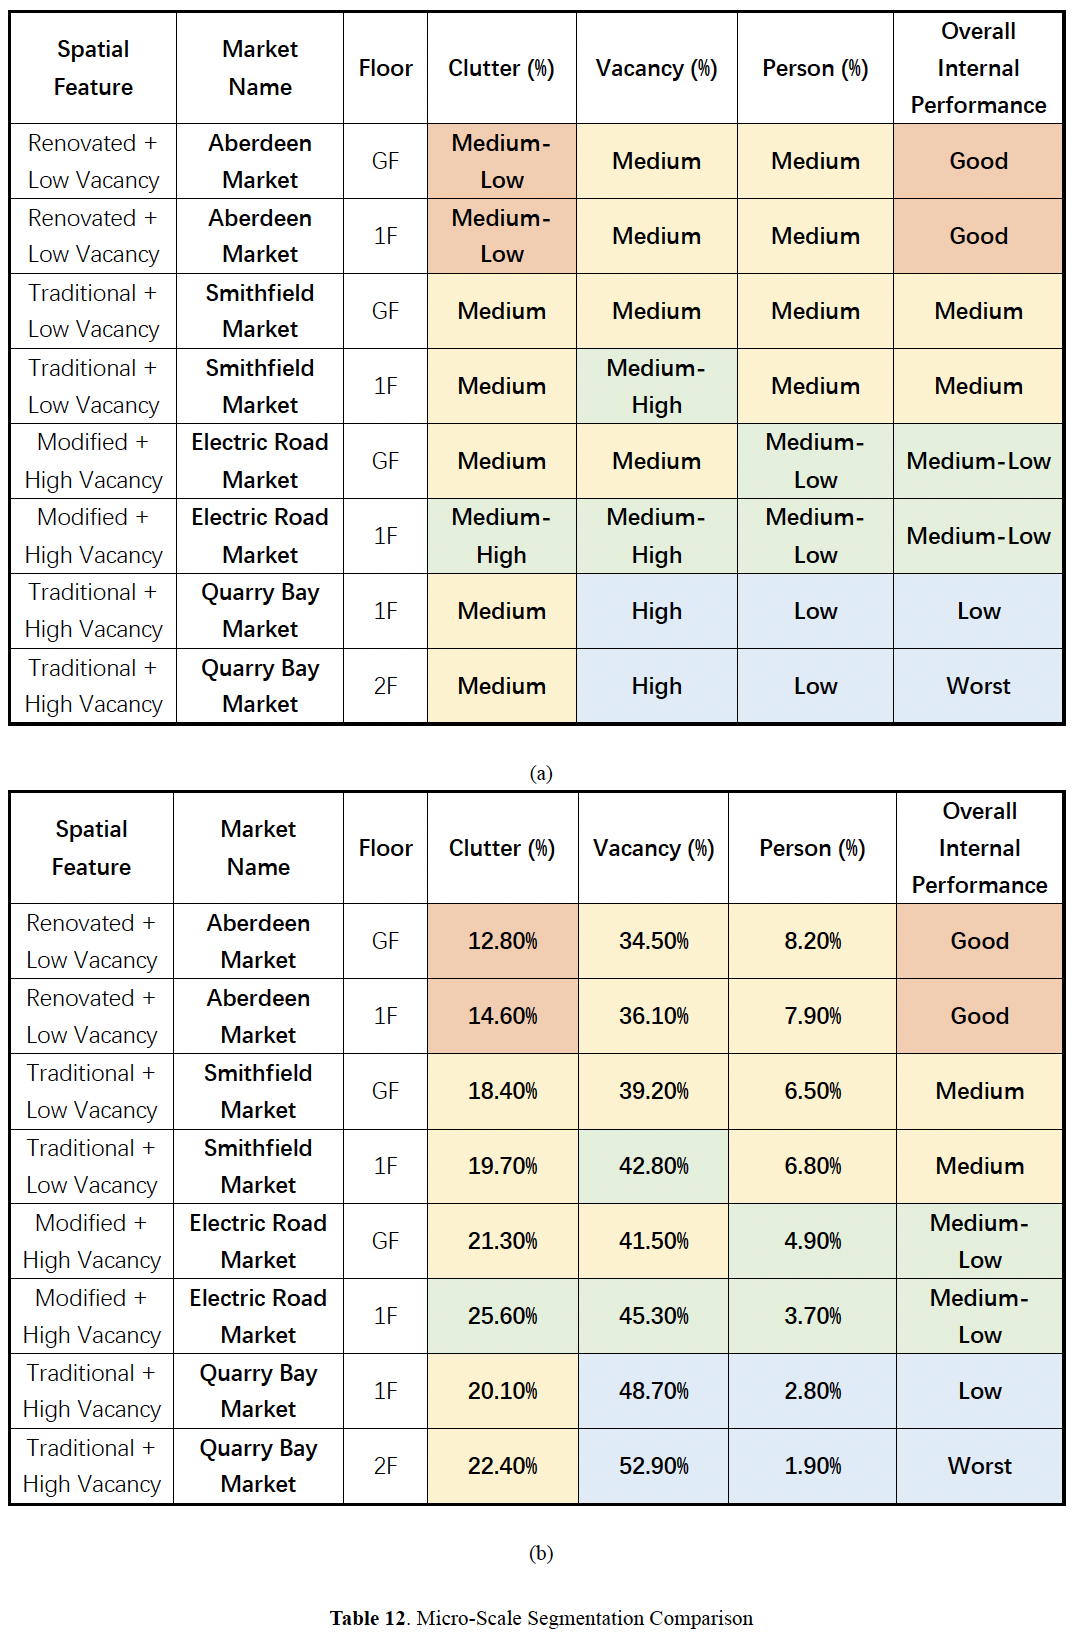
Table 12. Micro-Scale Segmentation Comparison, (a) top, (b) bottom
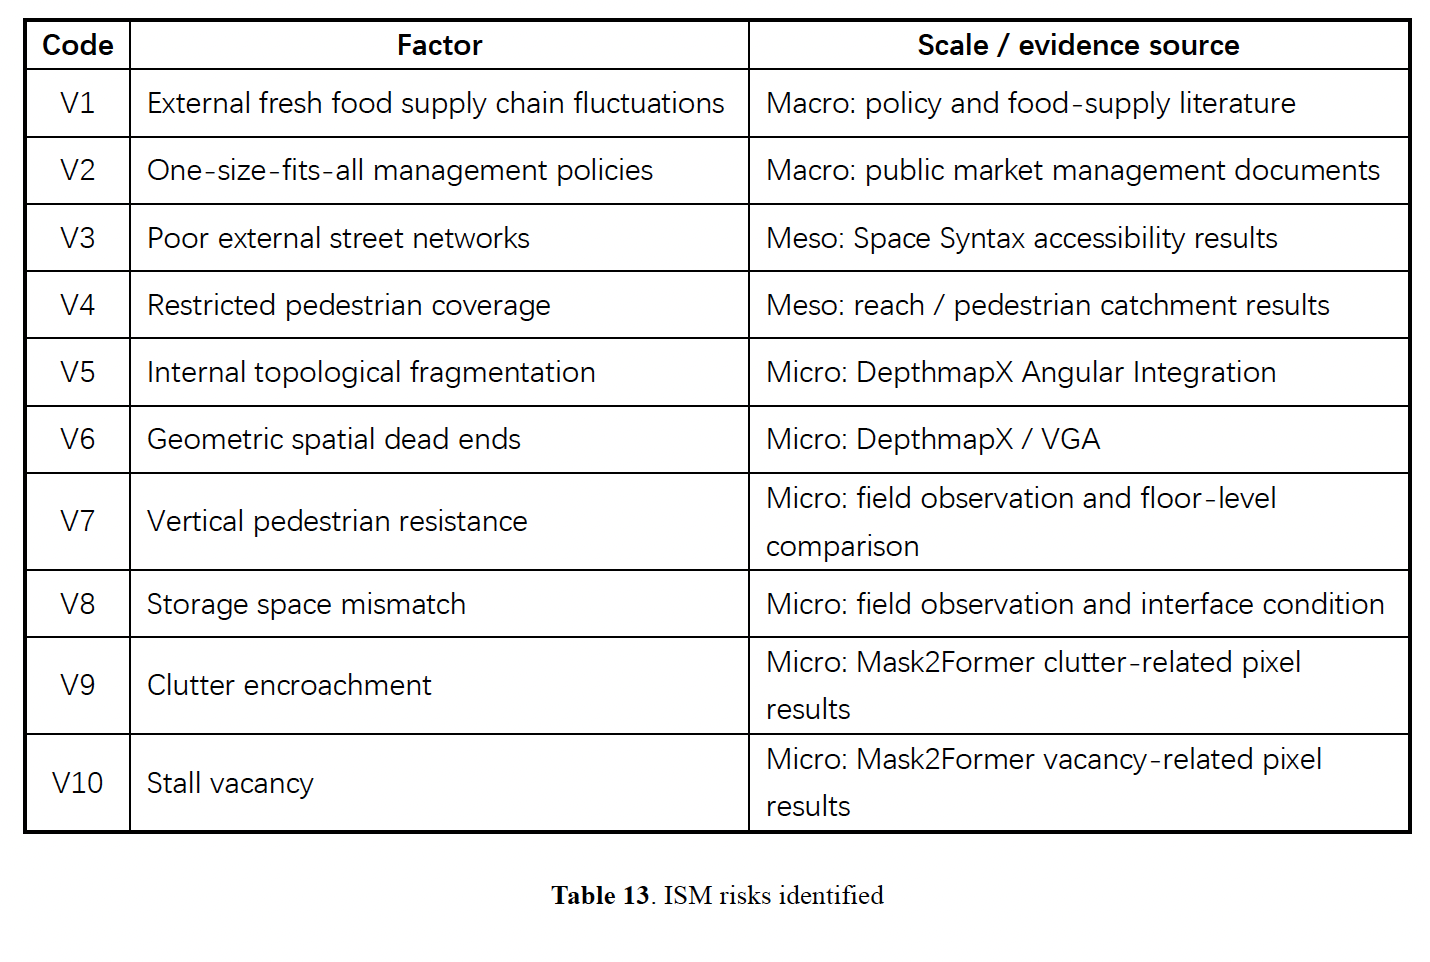
Table 13. ISM risks identified
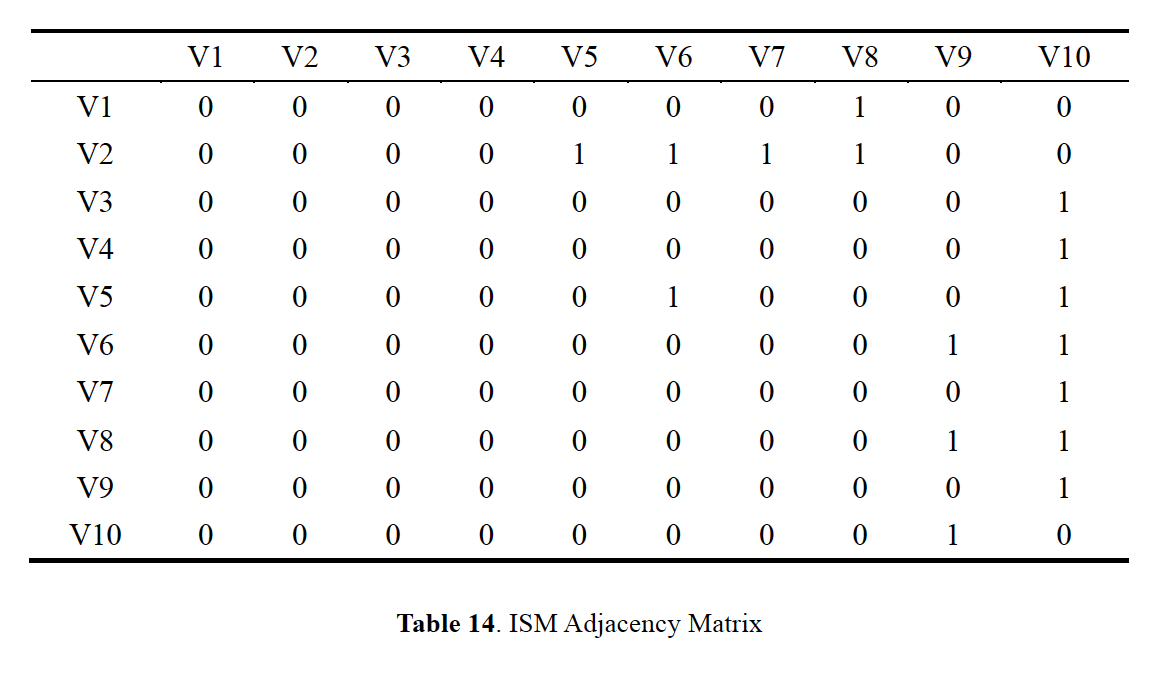
Table 14. ISM Adjacency Matrix
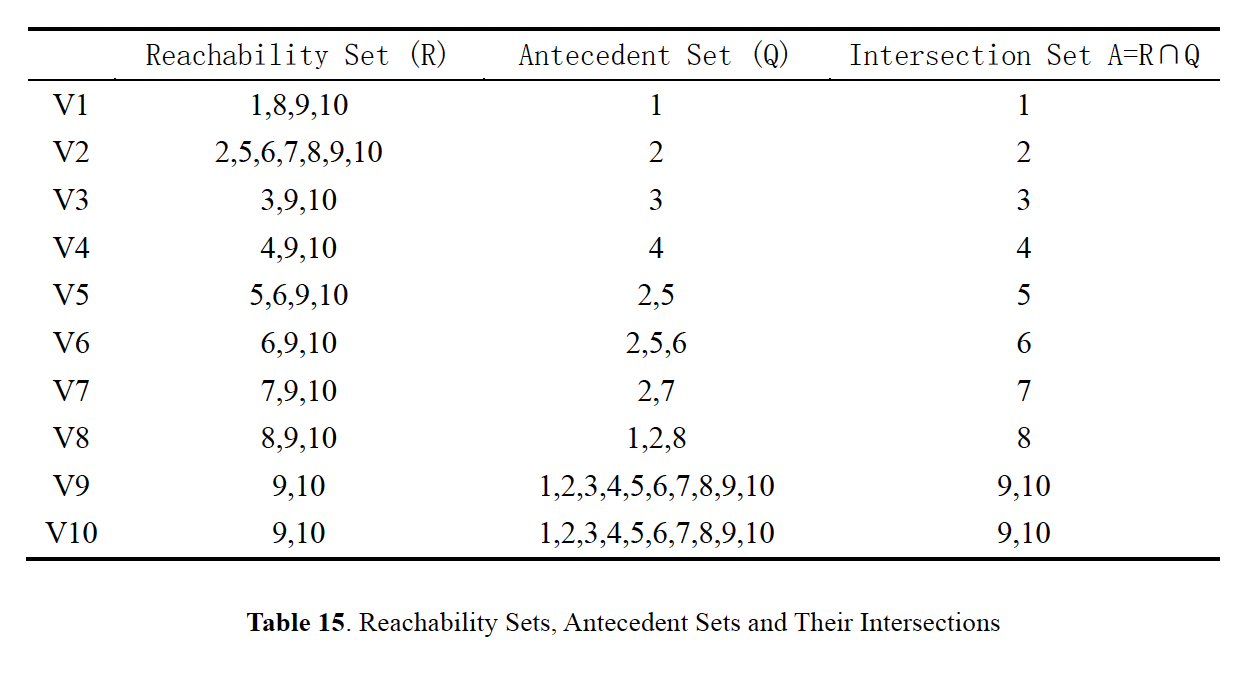
Table 15. Reachability Sets, Antecedent Sets and Their Intersections
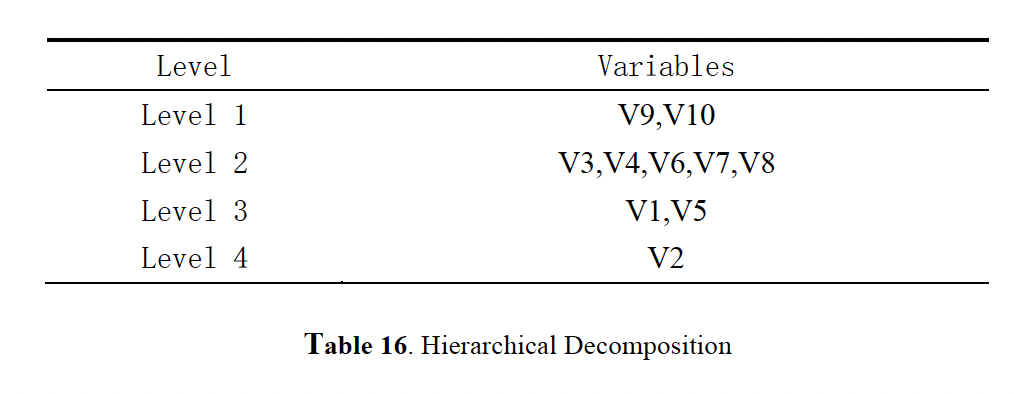
Table 16. Hierarchical Decomposition