Urbanie & Urbanus

Issue 8, P. - P.
The Relationship between Urban Morphology on Impervious Surface Coverage in High-Density Areas - The HK Northern Metropolitan Area as a Case Study
Figures
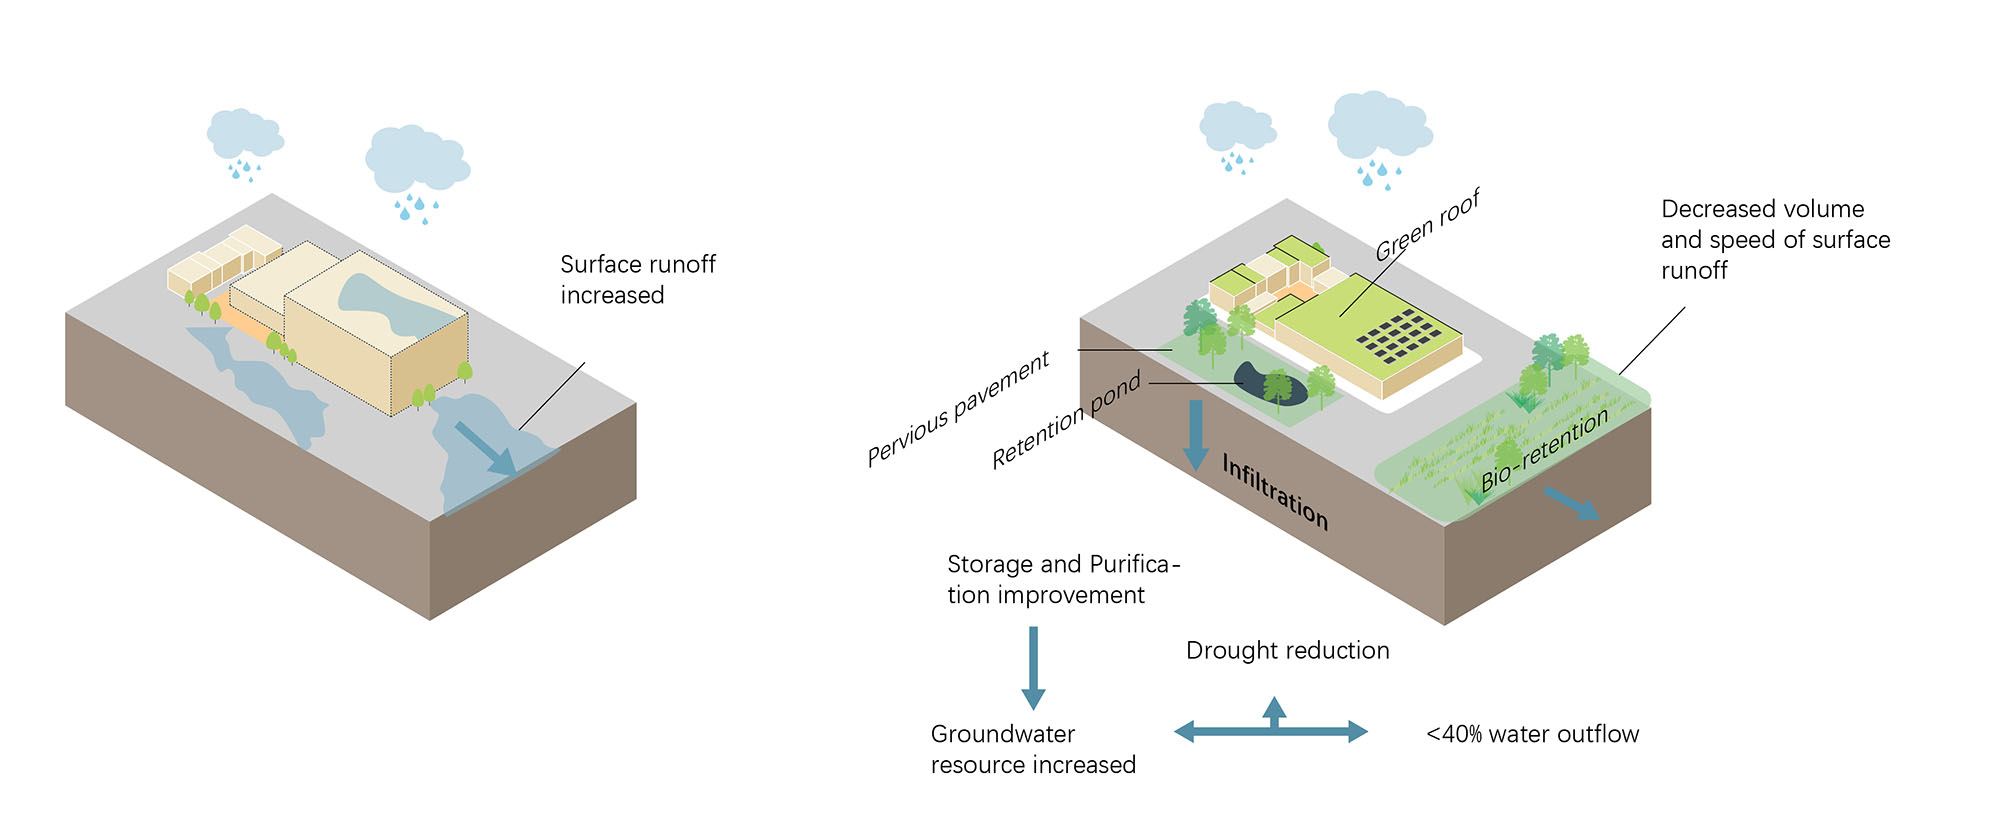
Figure 1. Difference between impervious surfaces and pervious surfaces, source: Author
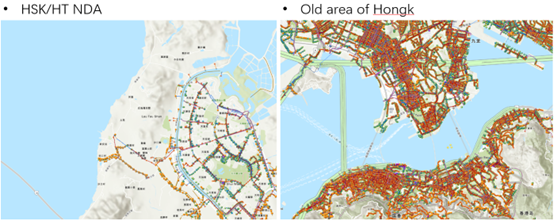
Figure 2. Drainage pipe distribution ,source: Drainage Services Department
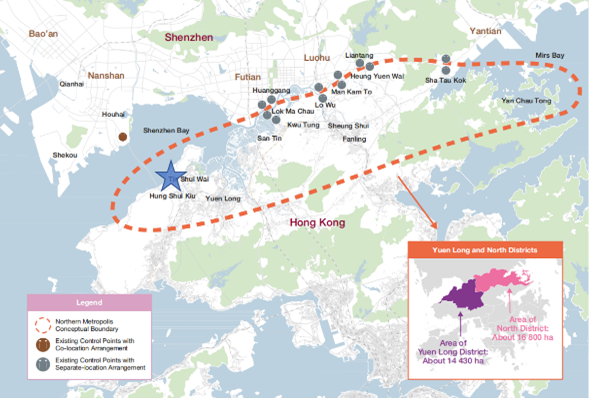
Figure 3. Northen metropolises area ,source: www.policyaddress.gov.hk/2021/eng/pdf
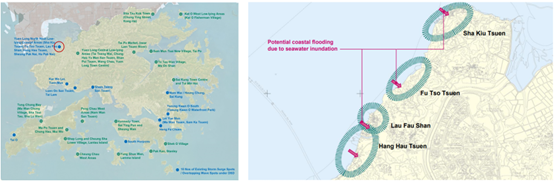
Figure 4. Existing storm spots , source: Drainage Services Department
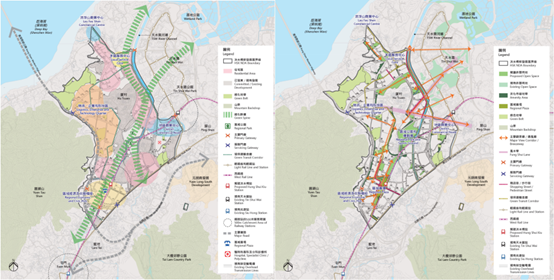
Figure 5. Urban Framework of New Development Area , source: planed.gov.hk. D_HKS_1_en
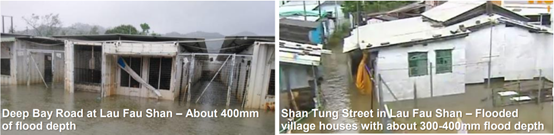
Figure 6. Historical waterlogging event, (Source: Drainage Services Department & AECOM)
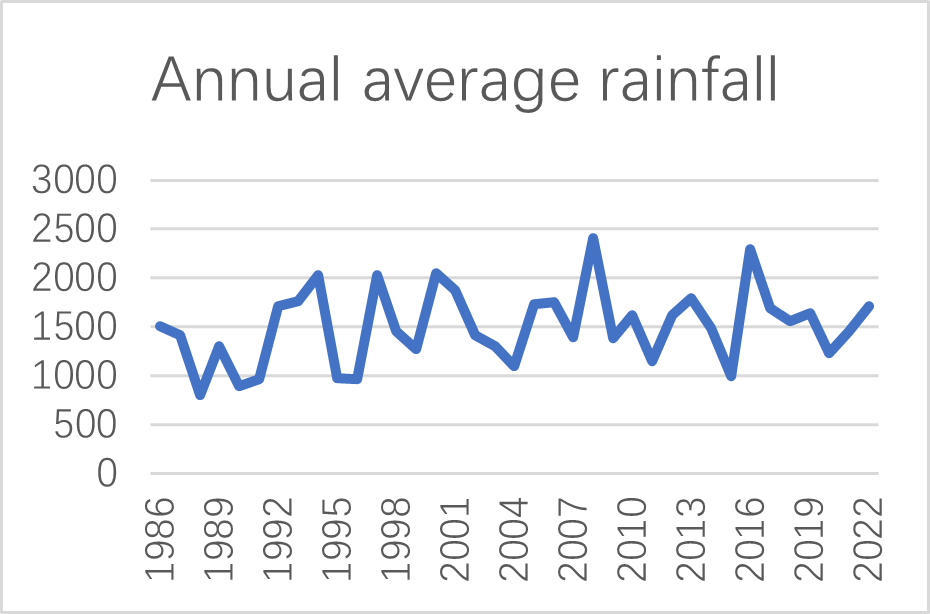
Figure 7. Annual average rainfall, source: Drainage Services Department
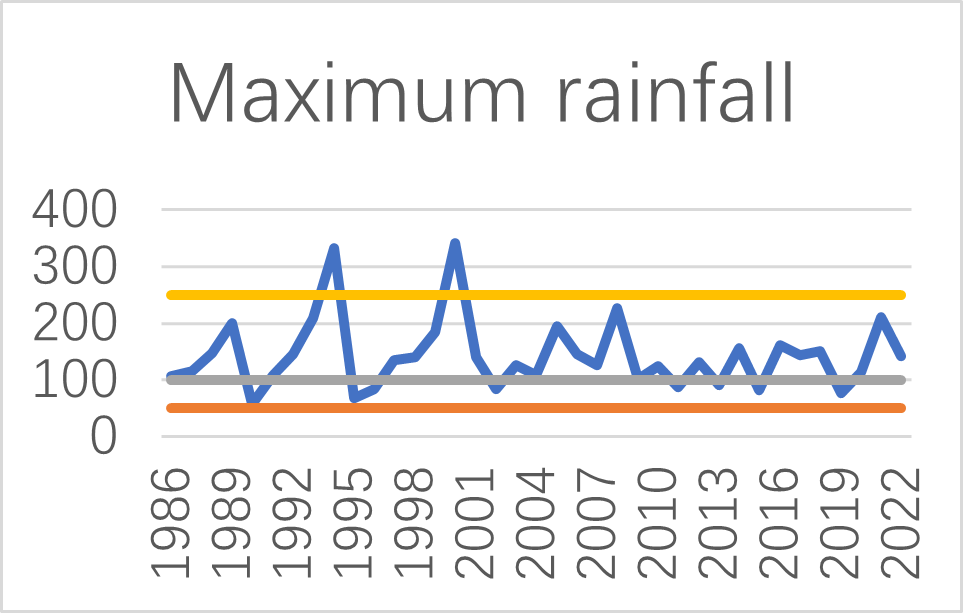
Figure 8. Maximum rainfall, source: Drainage Services Department
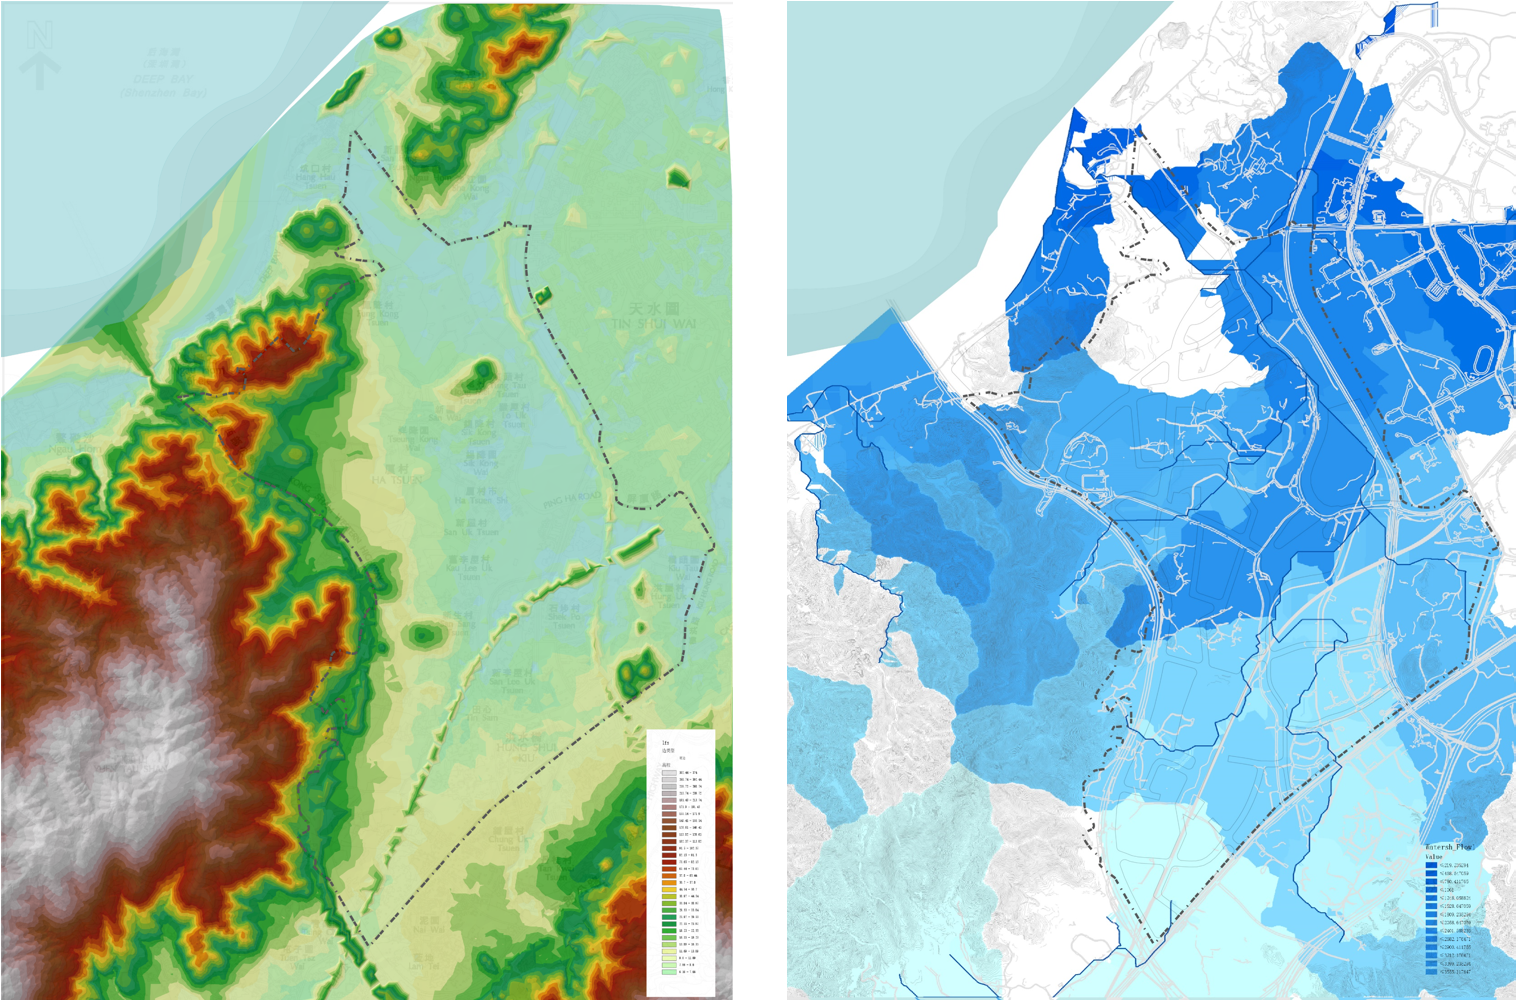
Figure 9. Topographic elevation analysis & Watershed area analysis, source: Author
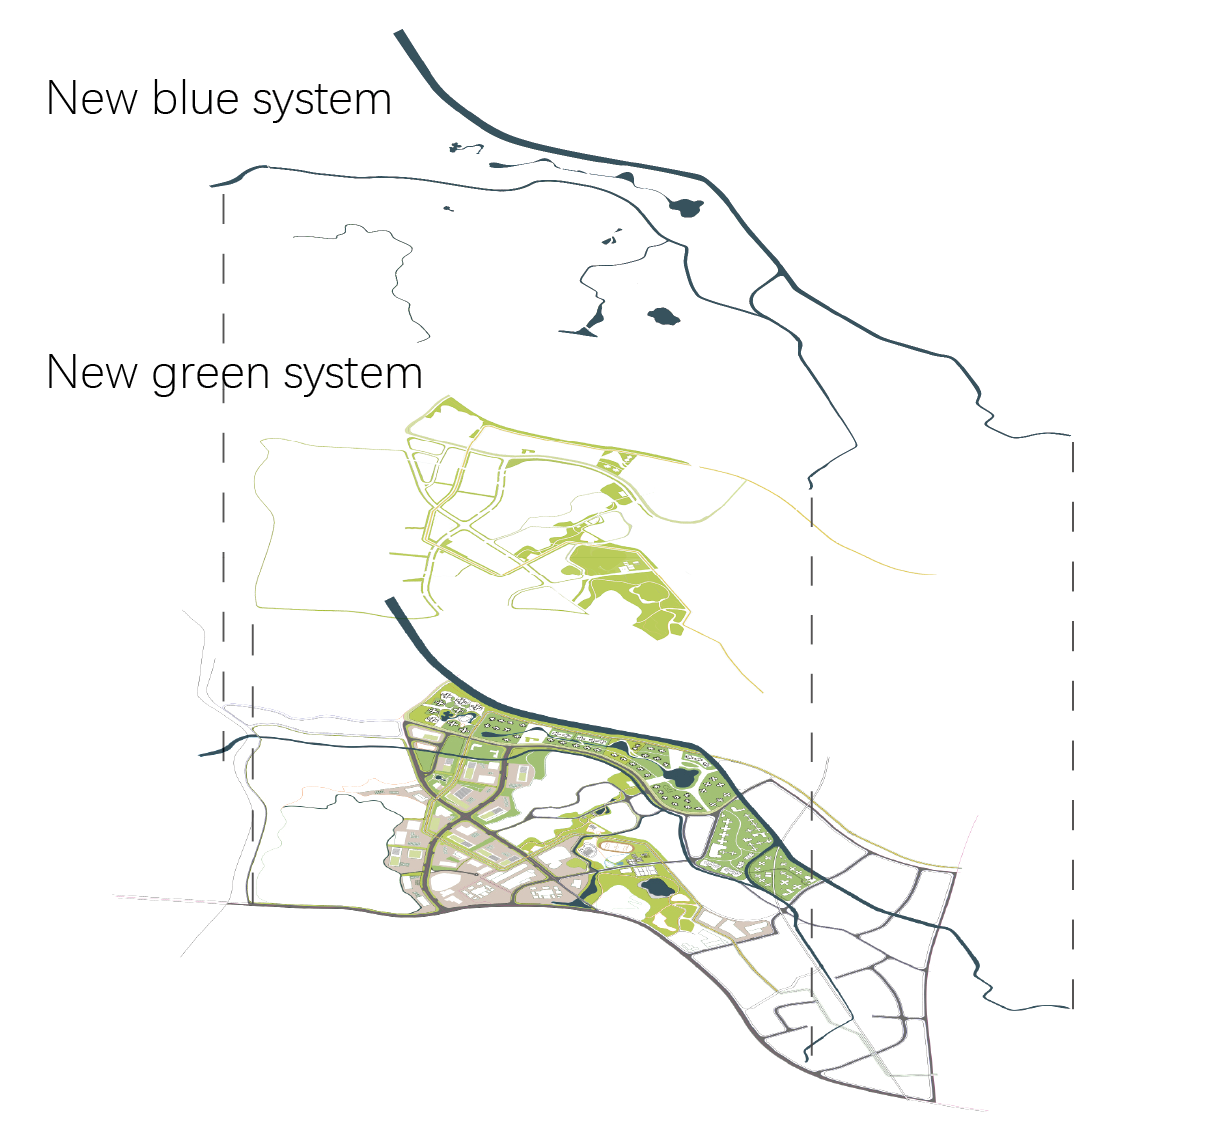
Figure 10. blue & green system, source: Author
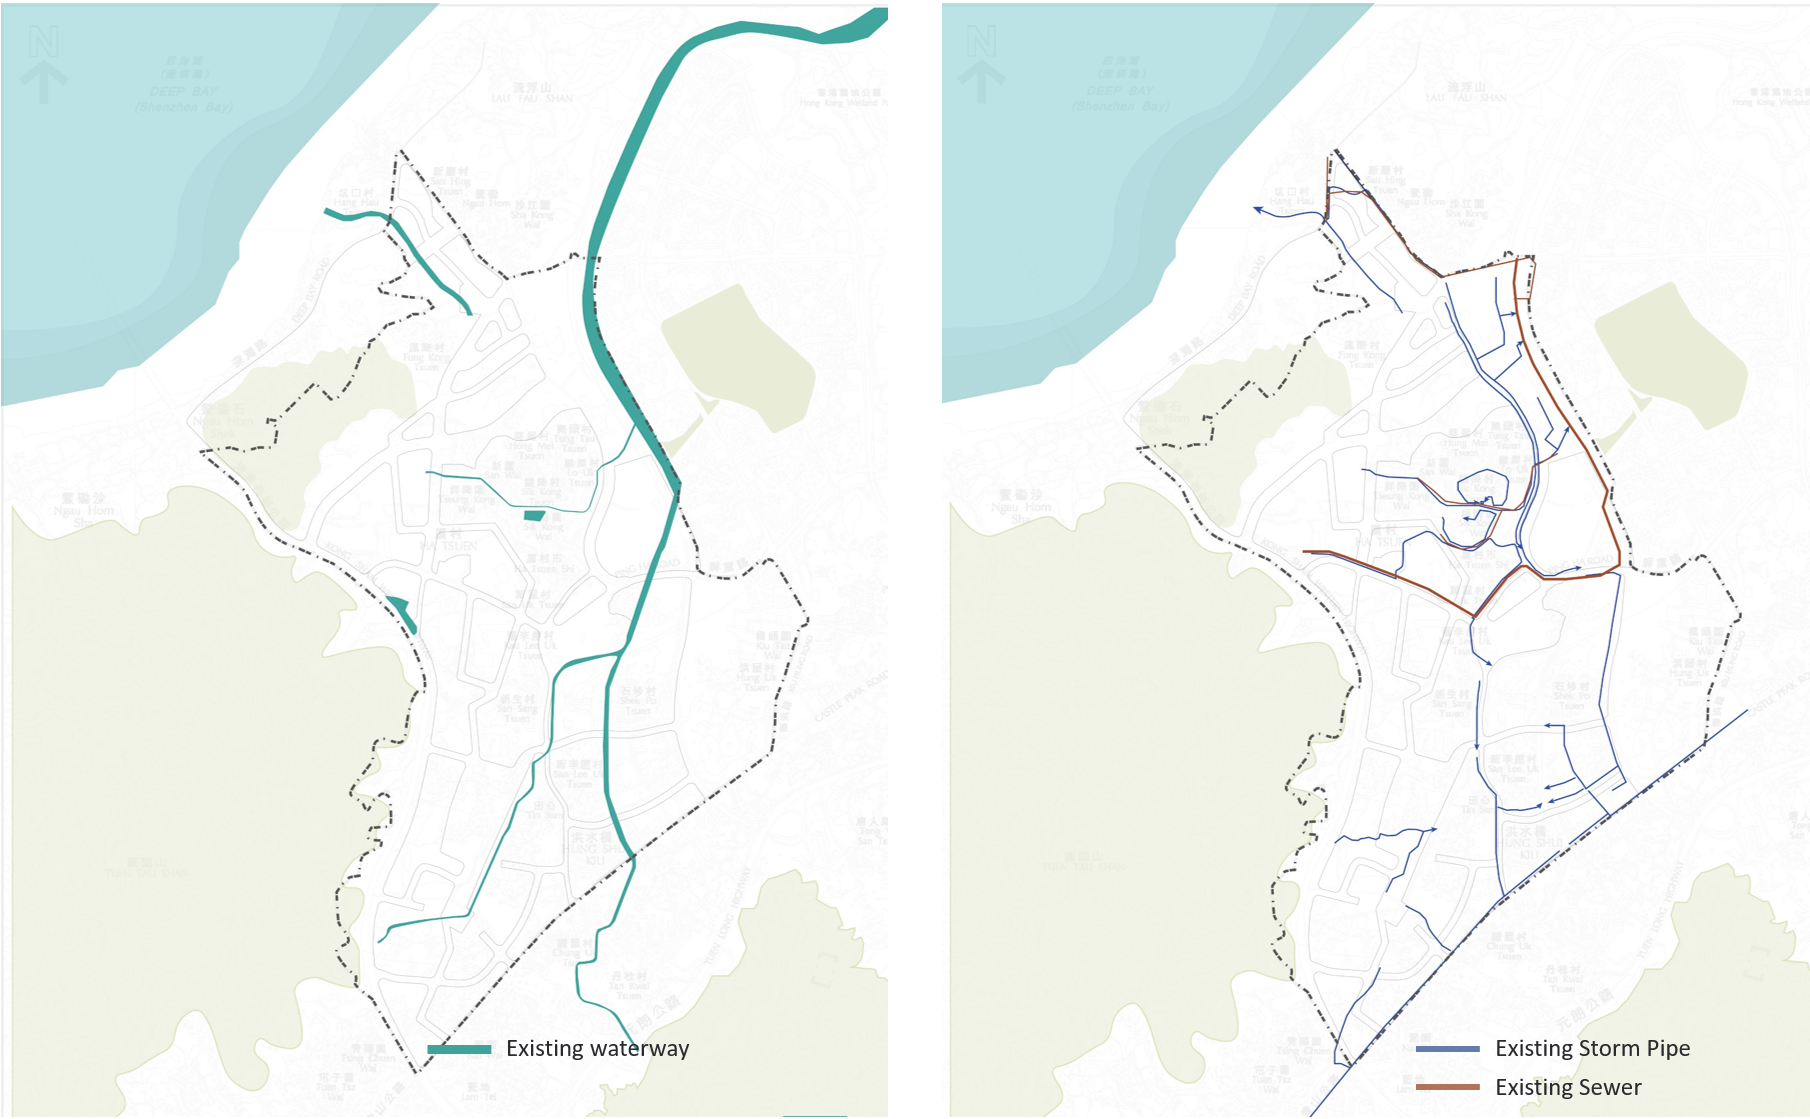
Figure 11. Existing Water System & Existing Storm Drainage System, source: Drainage Services Department & Self-drawn by the author
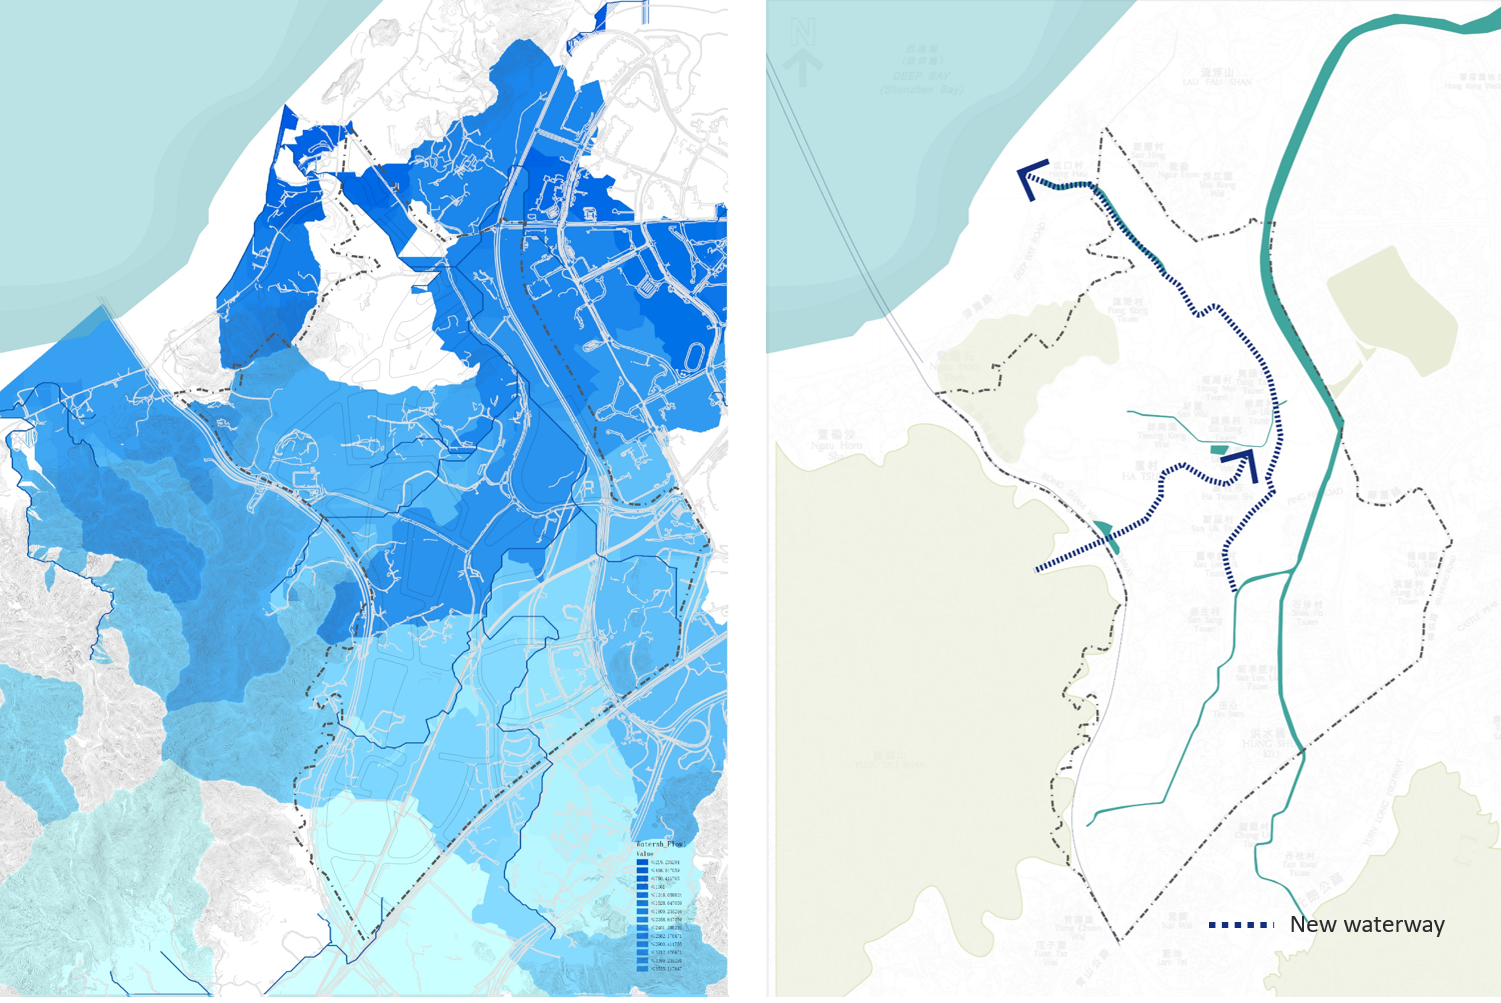
Figure 12. Watershed area & Proposed Water System , source: Author
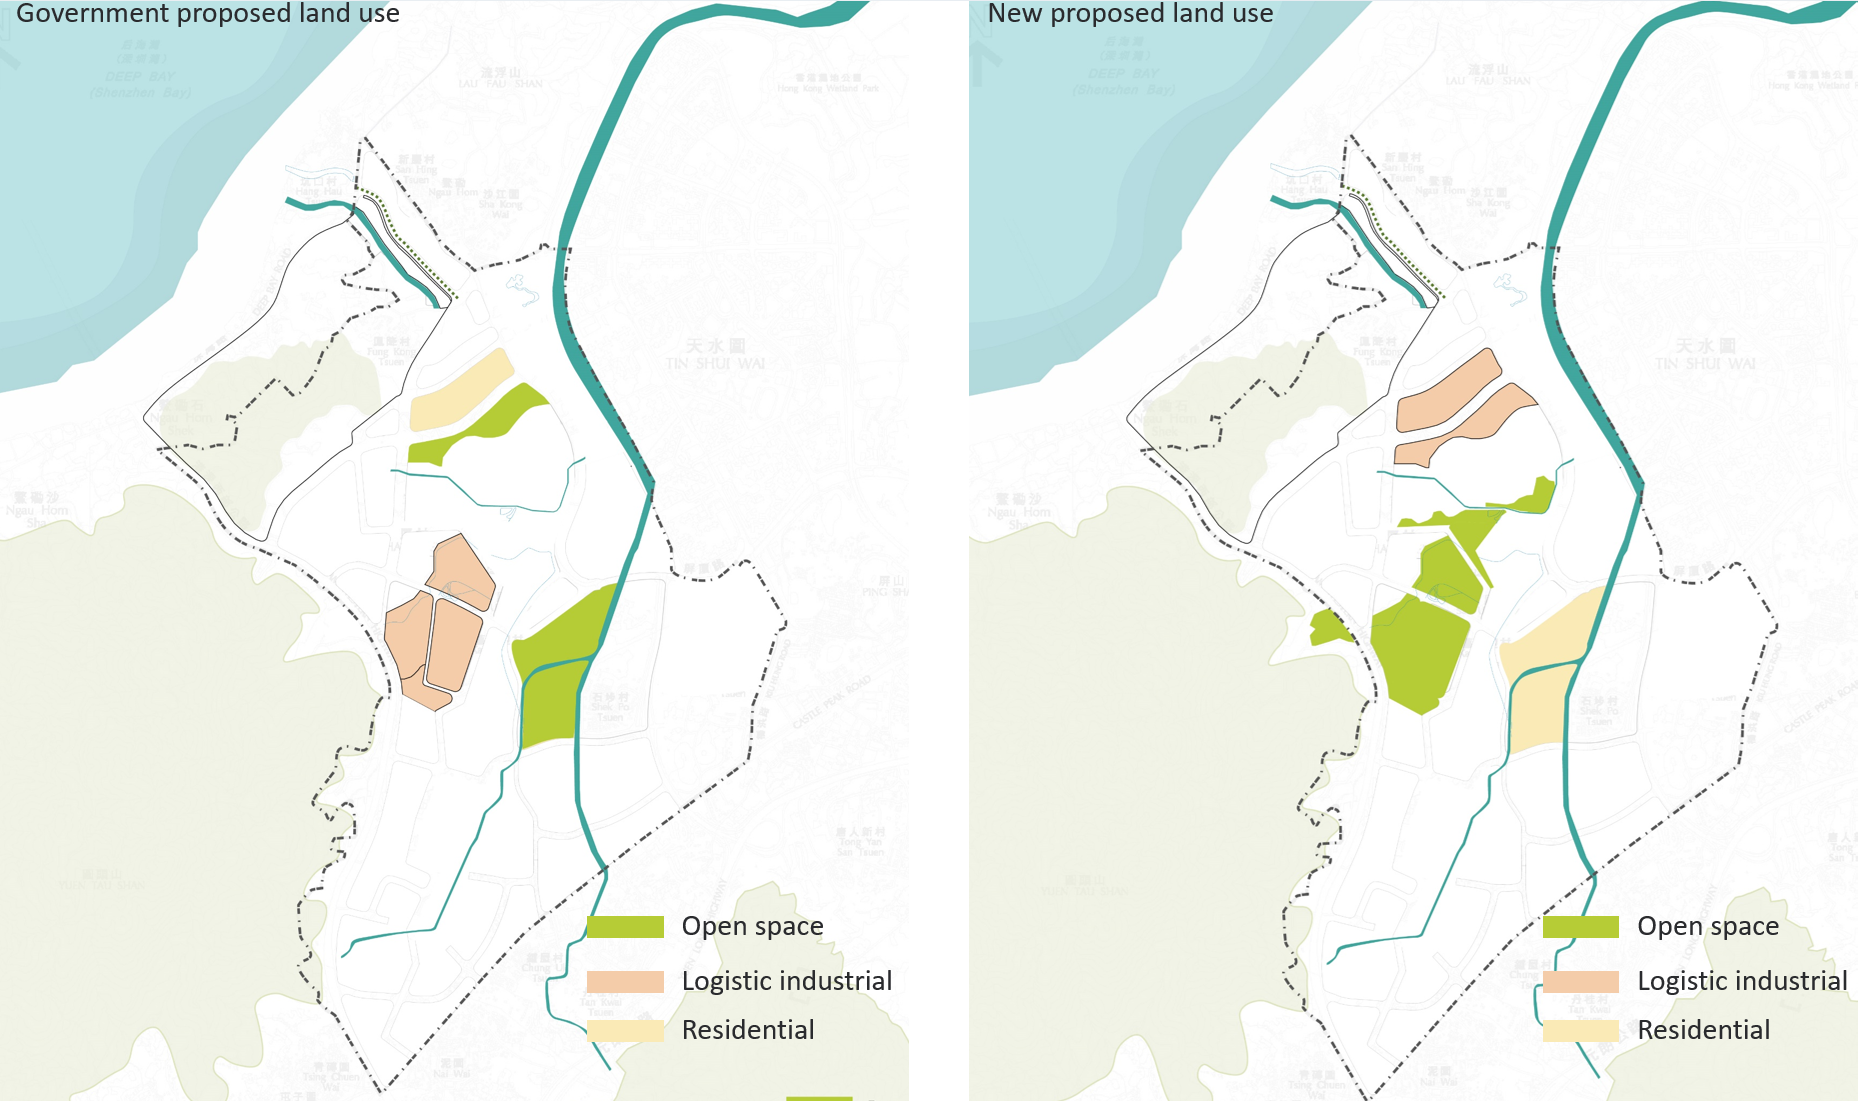
Figure 13. Land use in government’s programs & New land use, source: Author
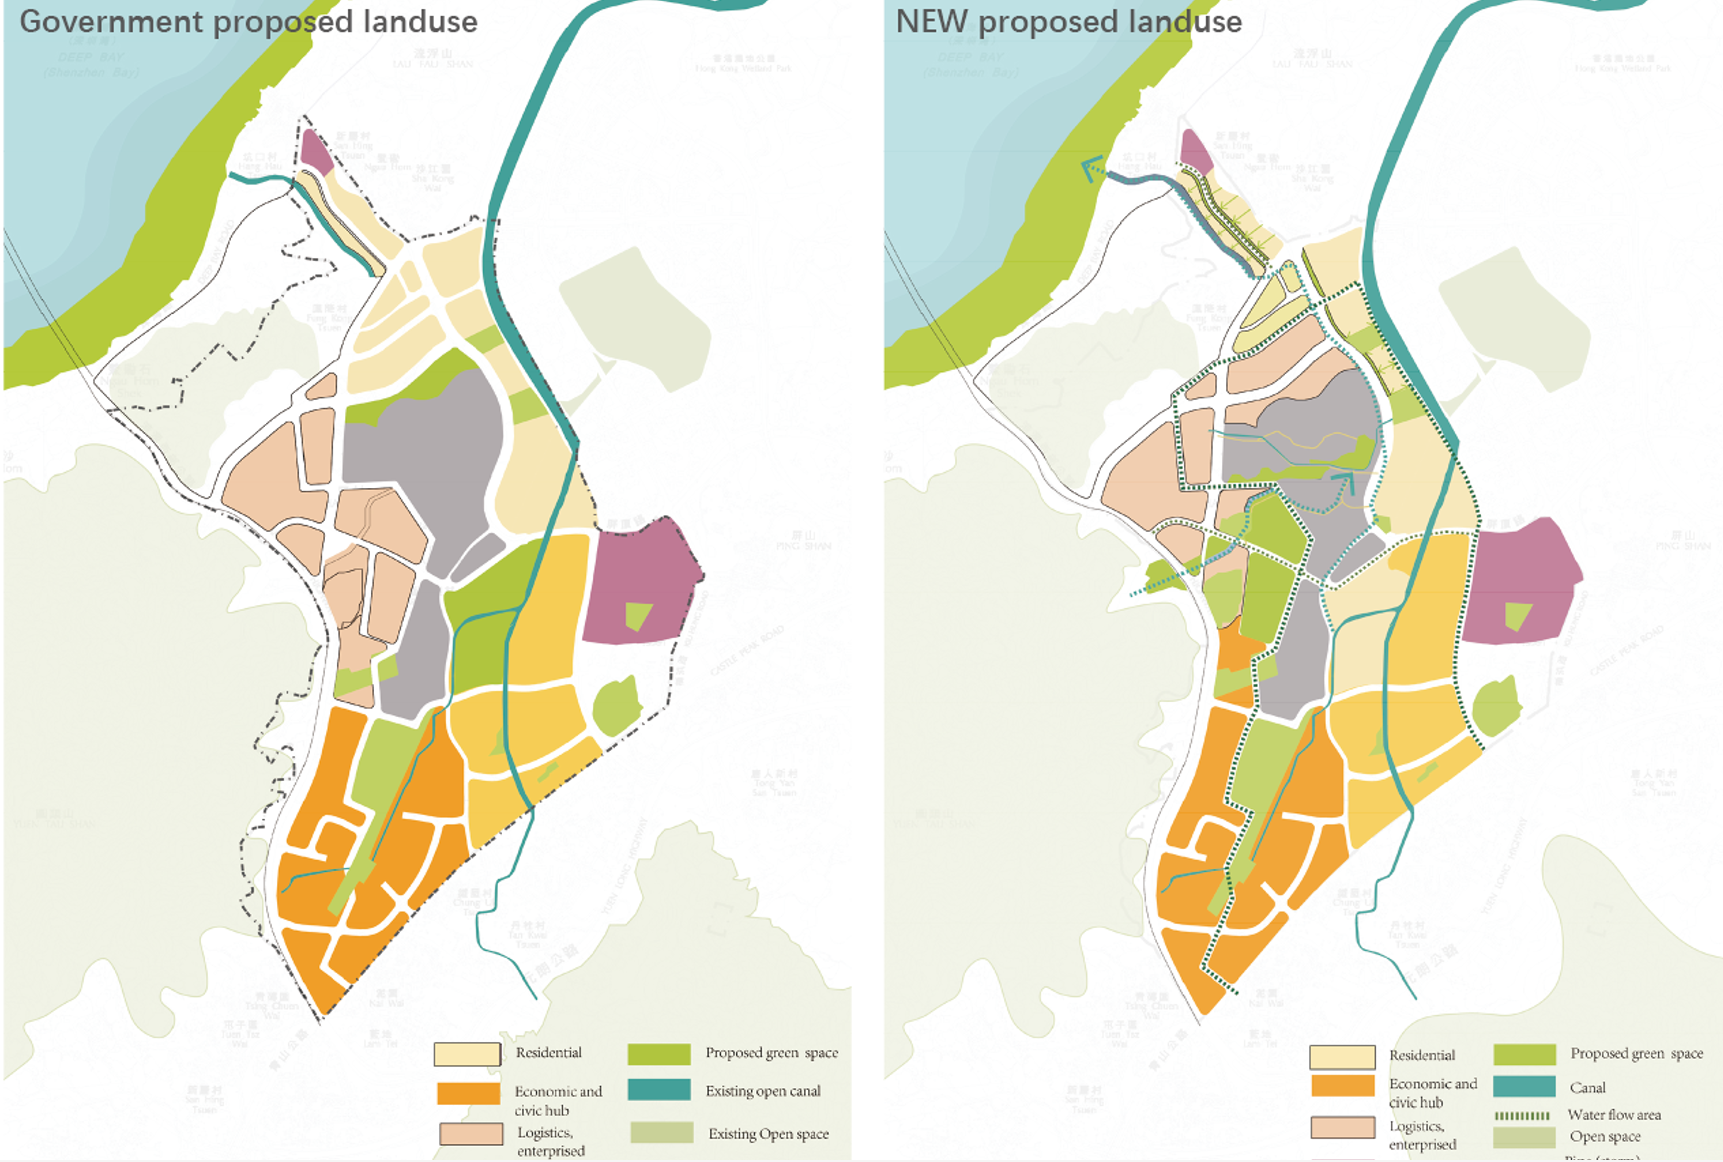
Figure 14. Overall land use in government’s programs & New land use, source: Author
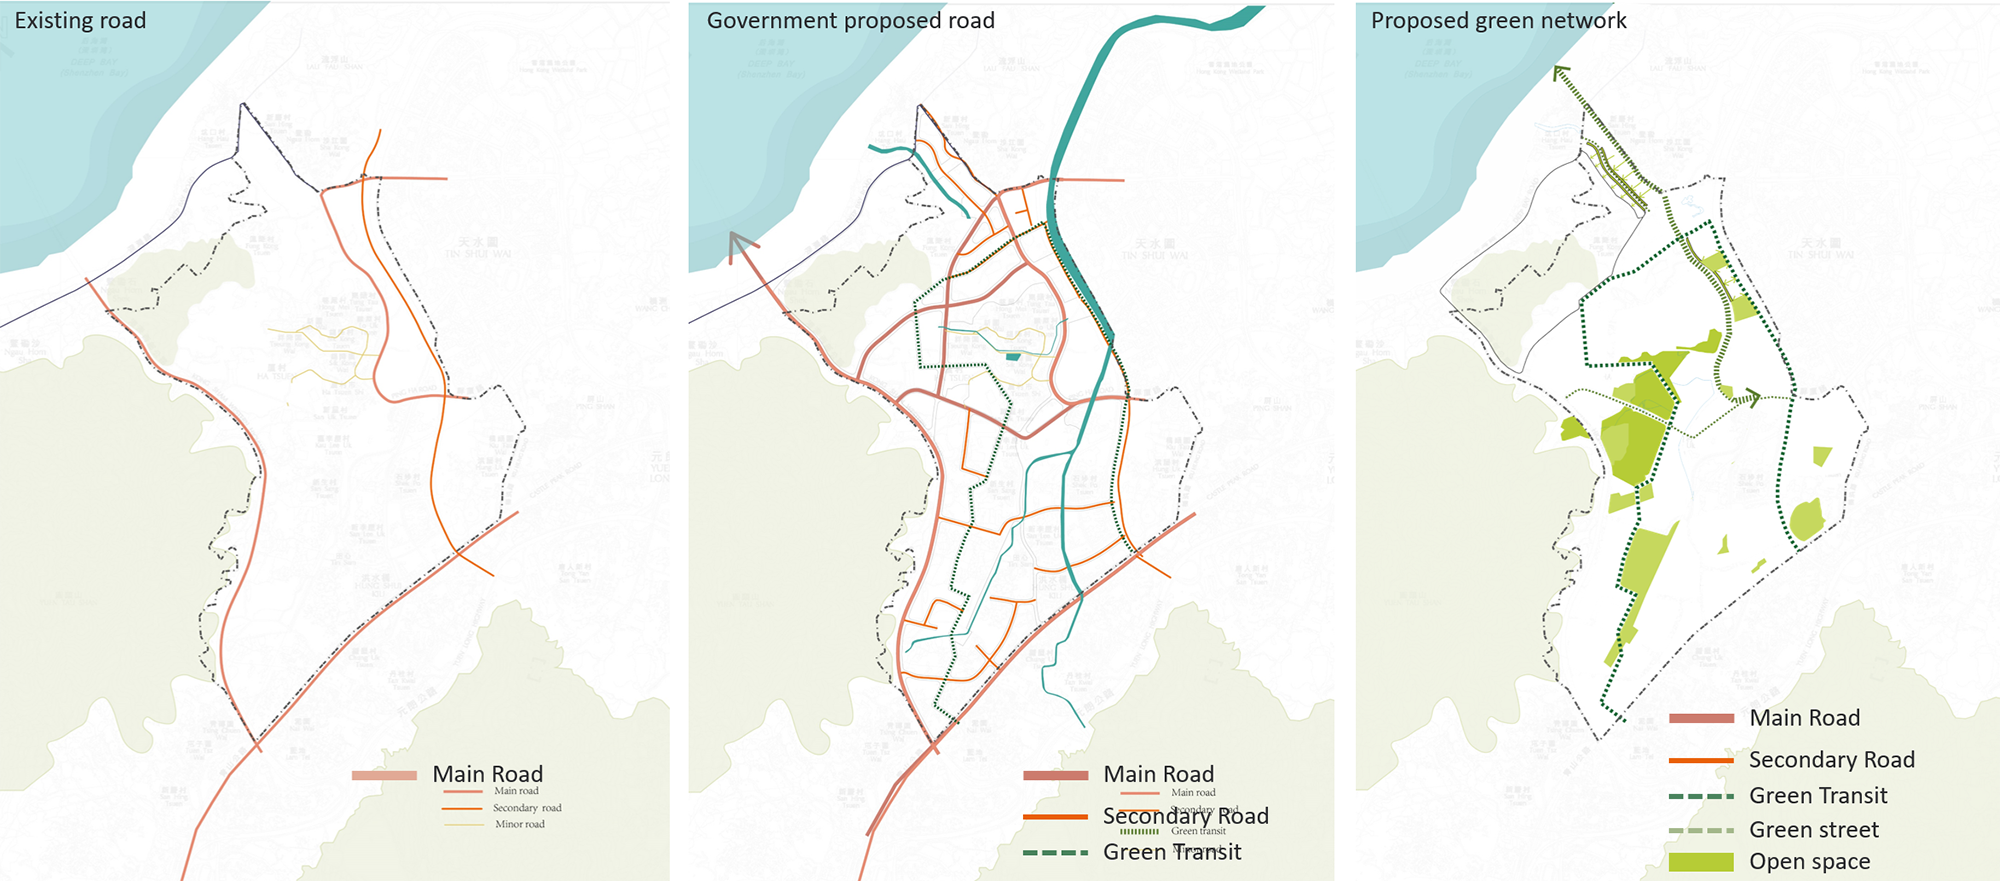
Figure 15. Existing road network & Government proposed road network & Green network, source: Author
![]()
Figure 16. Green transit, source: Author
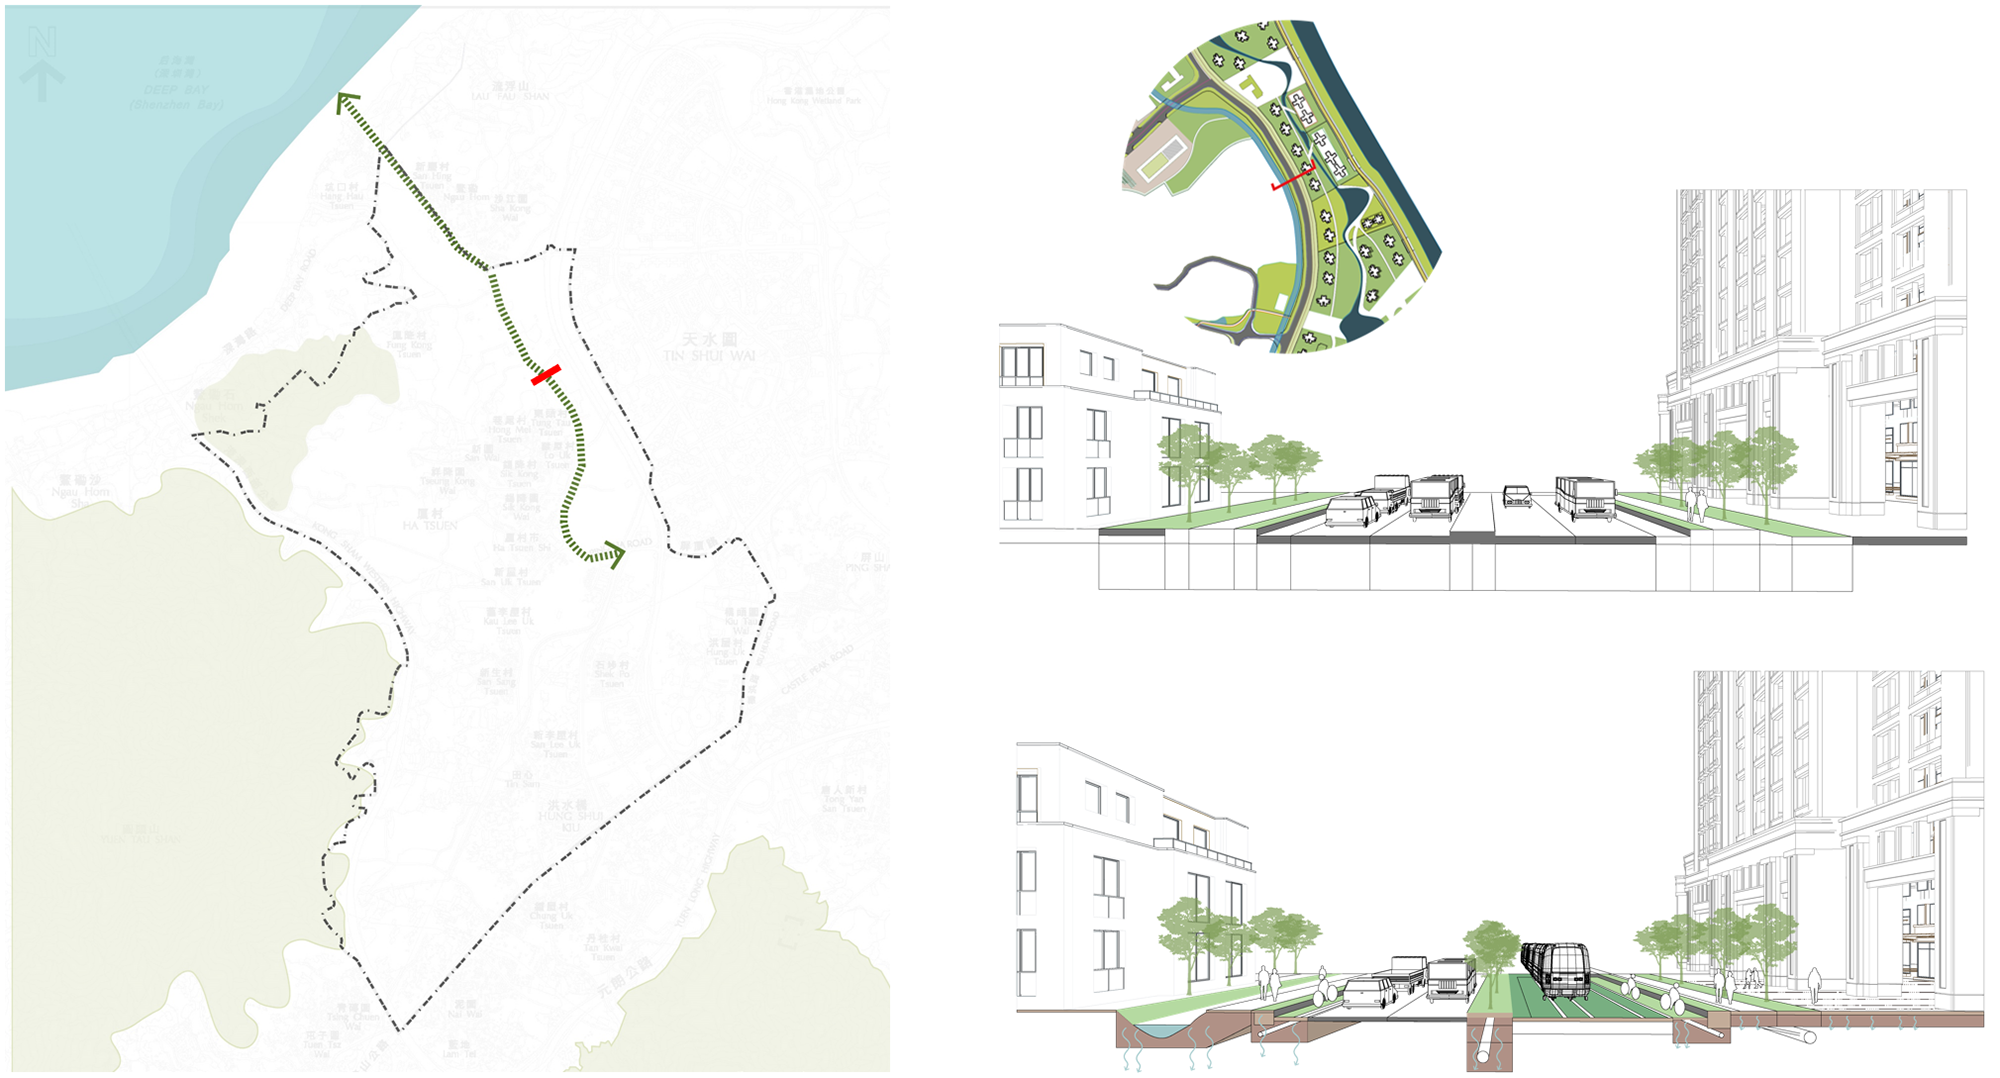
Figure 17. New green street near the residential area, source: Author
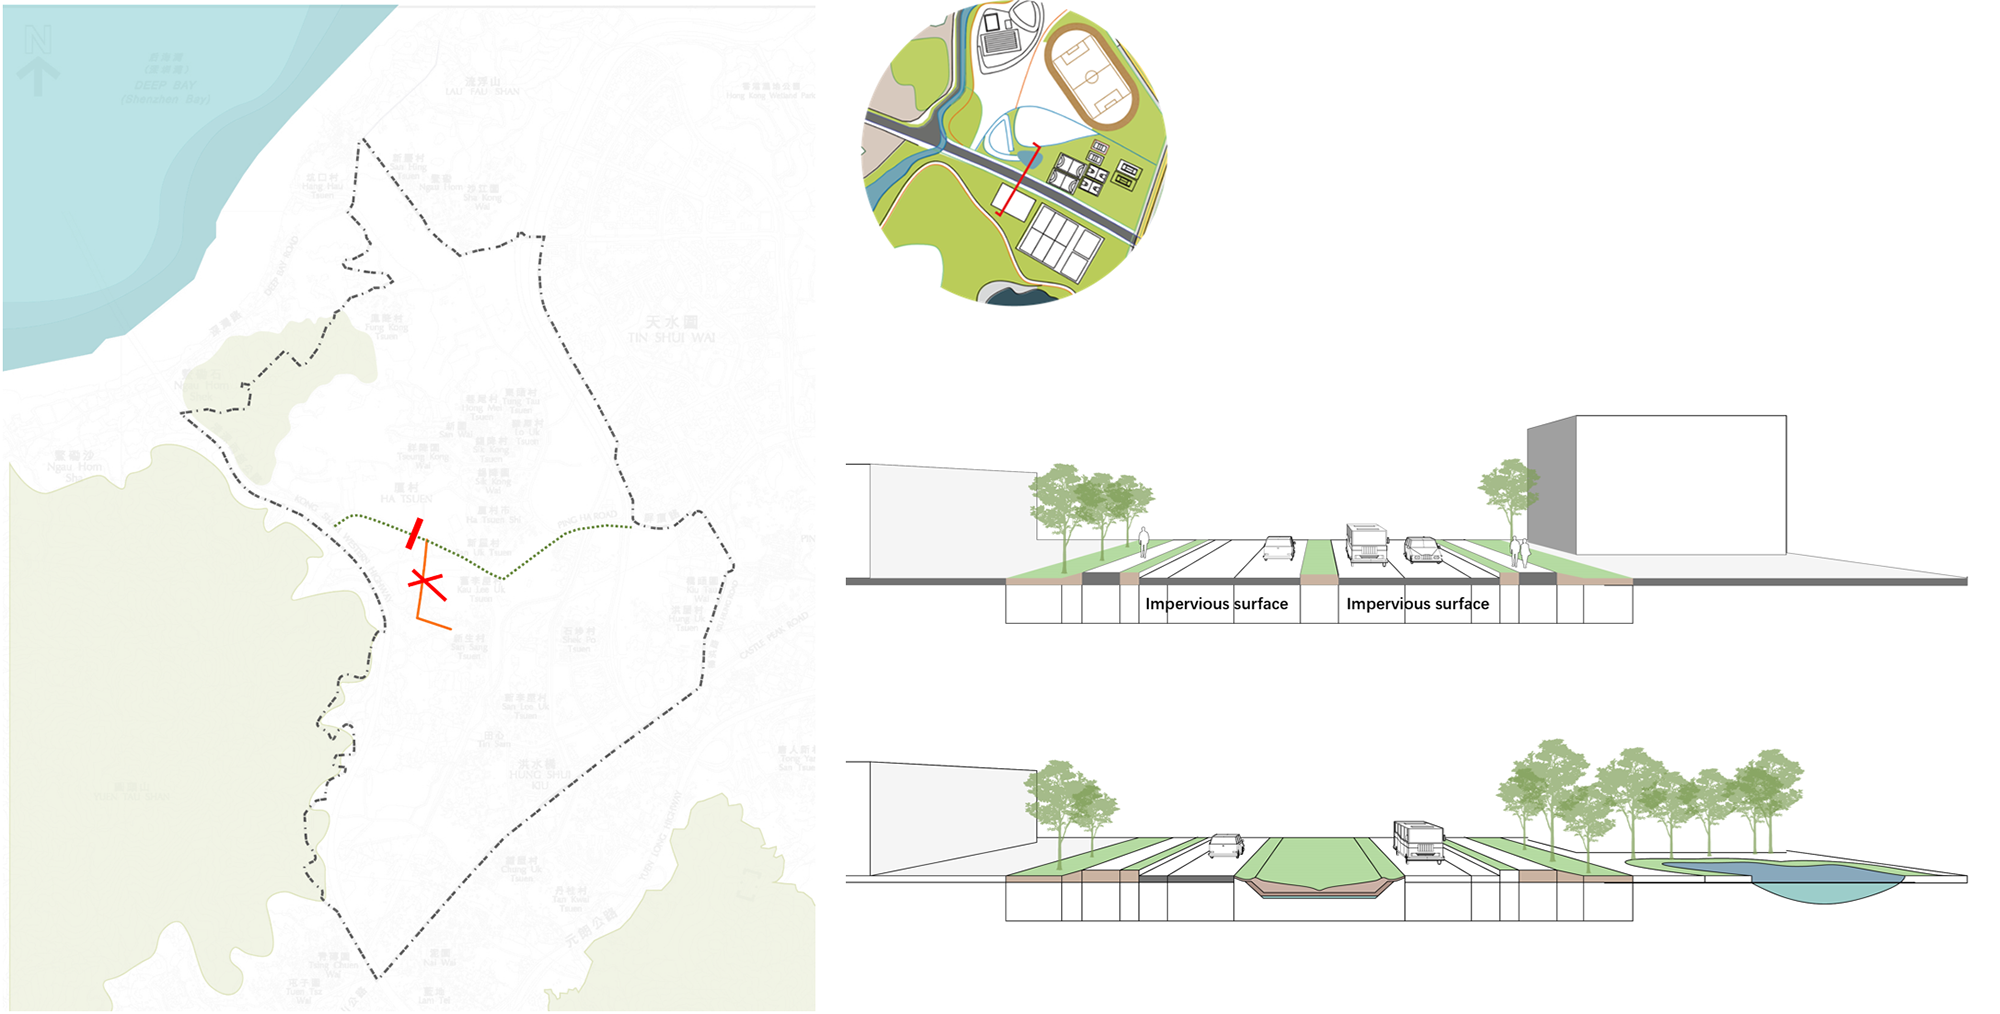
Figure 18. Rain garden road
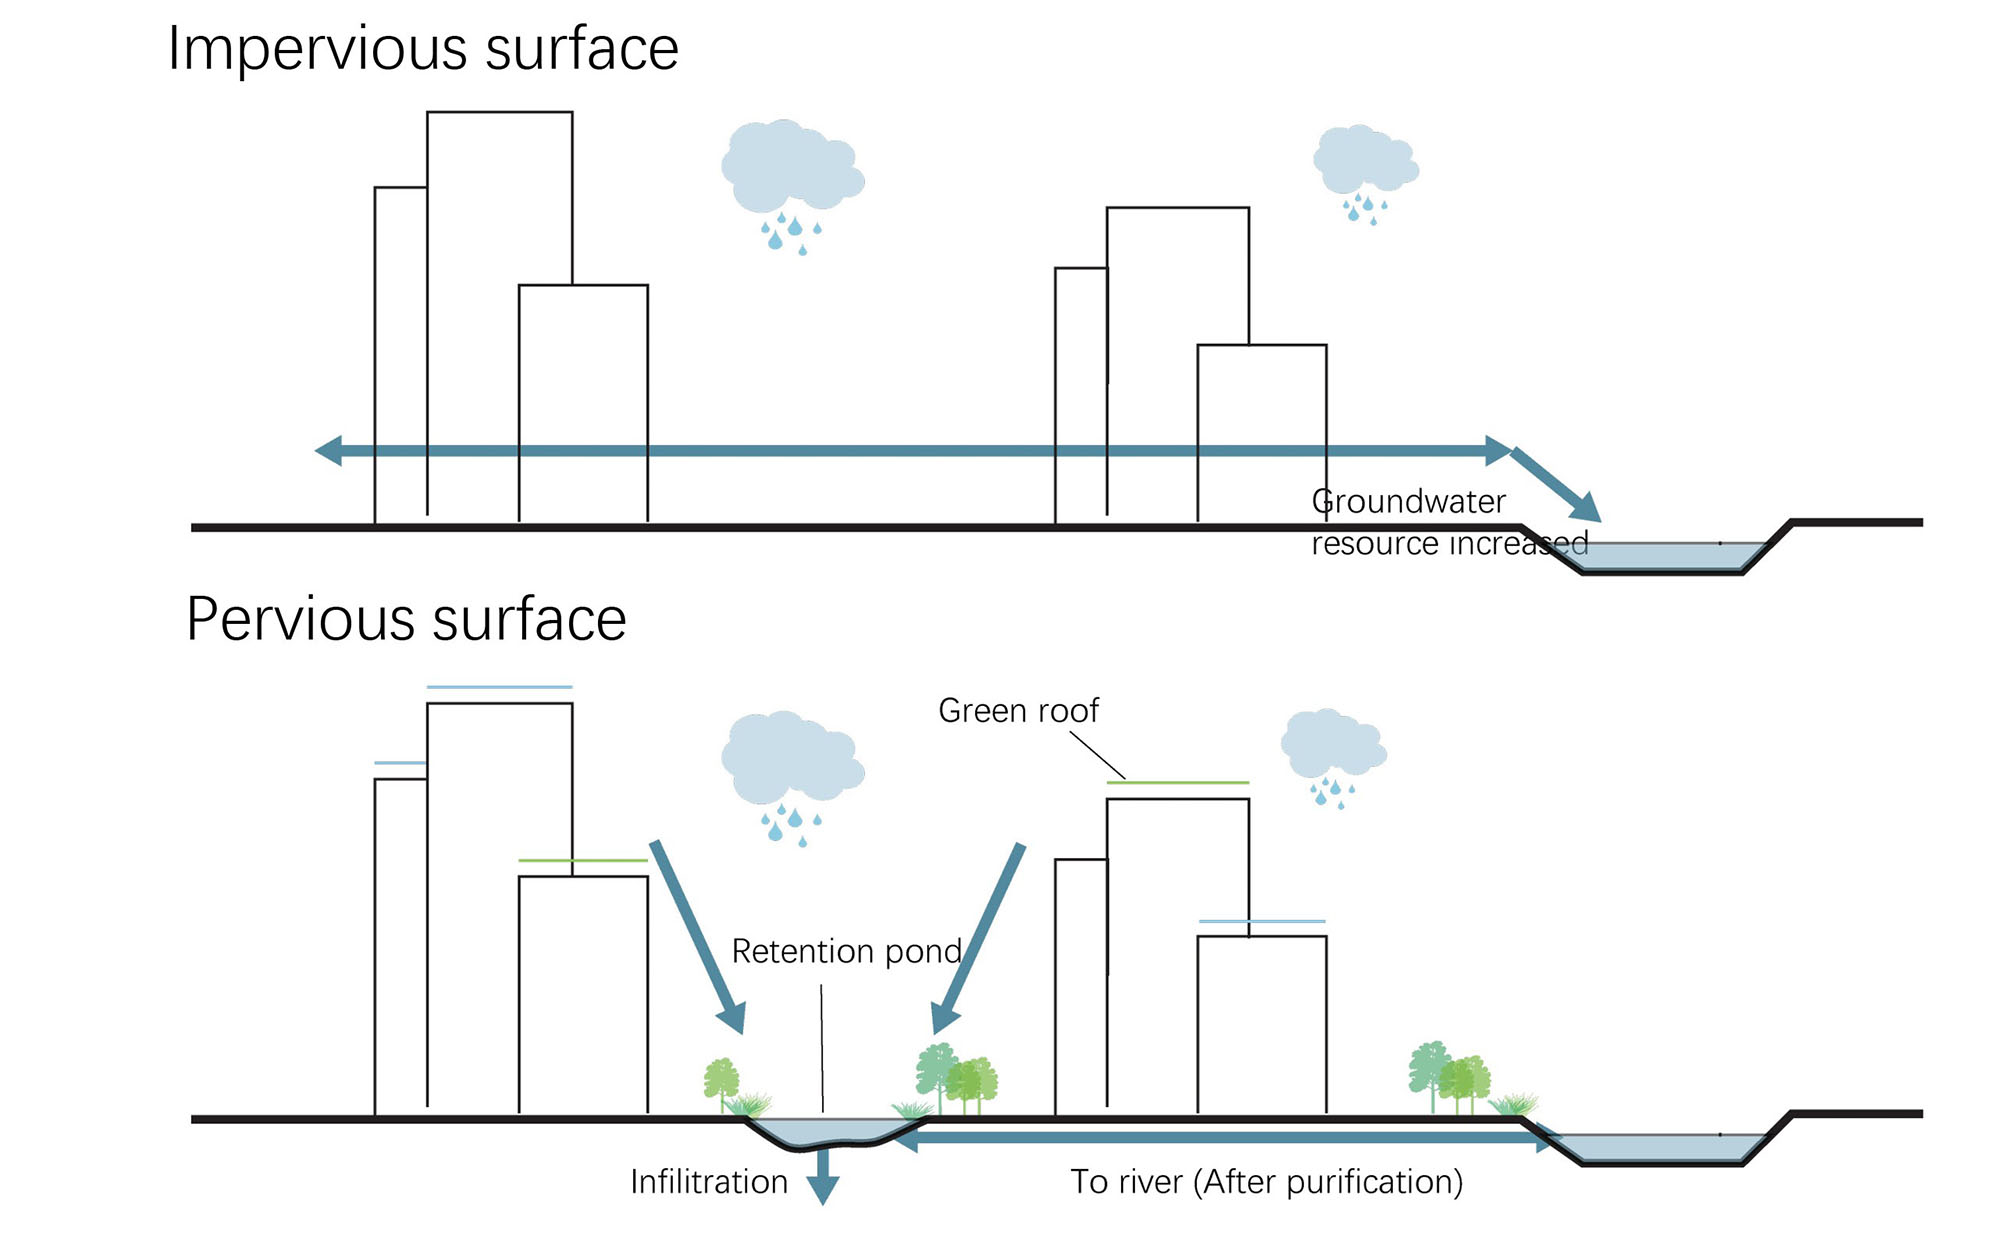
Figure 19. Rainwater flow process, source: Author
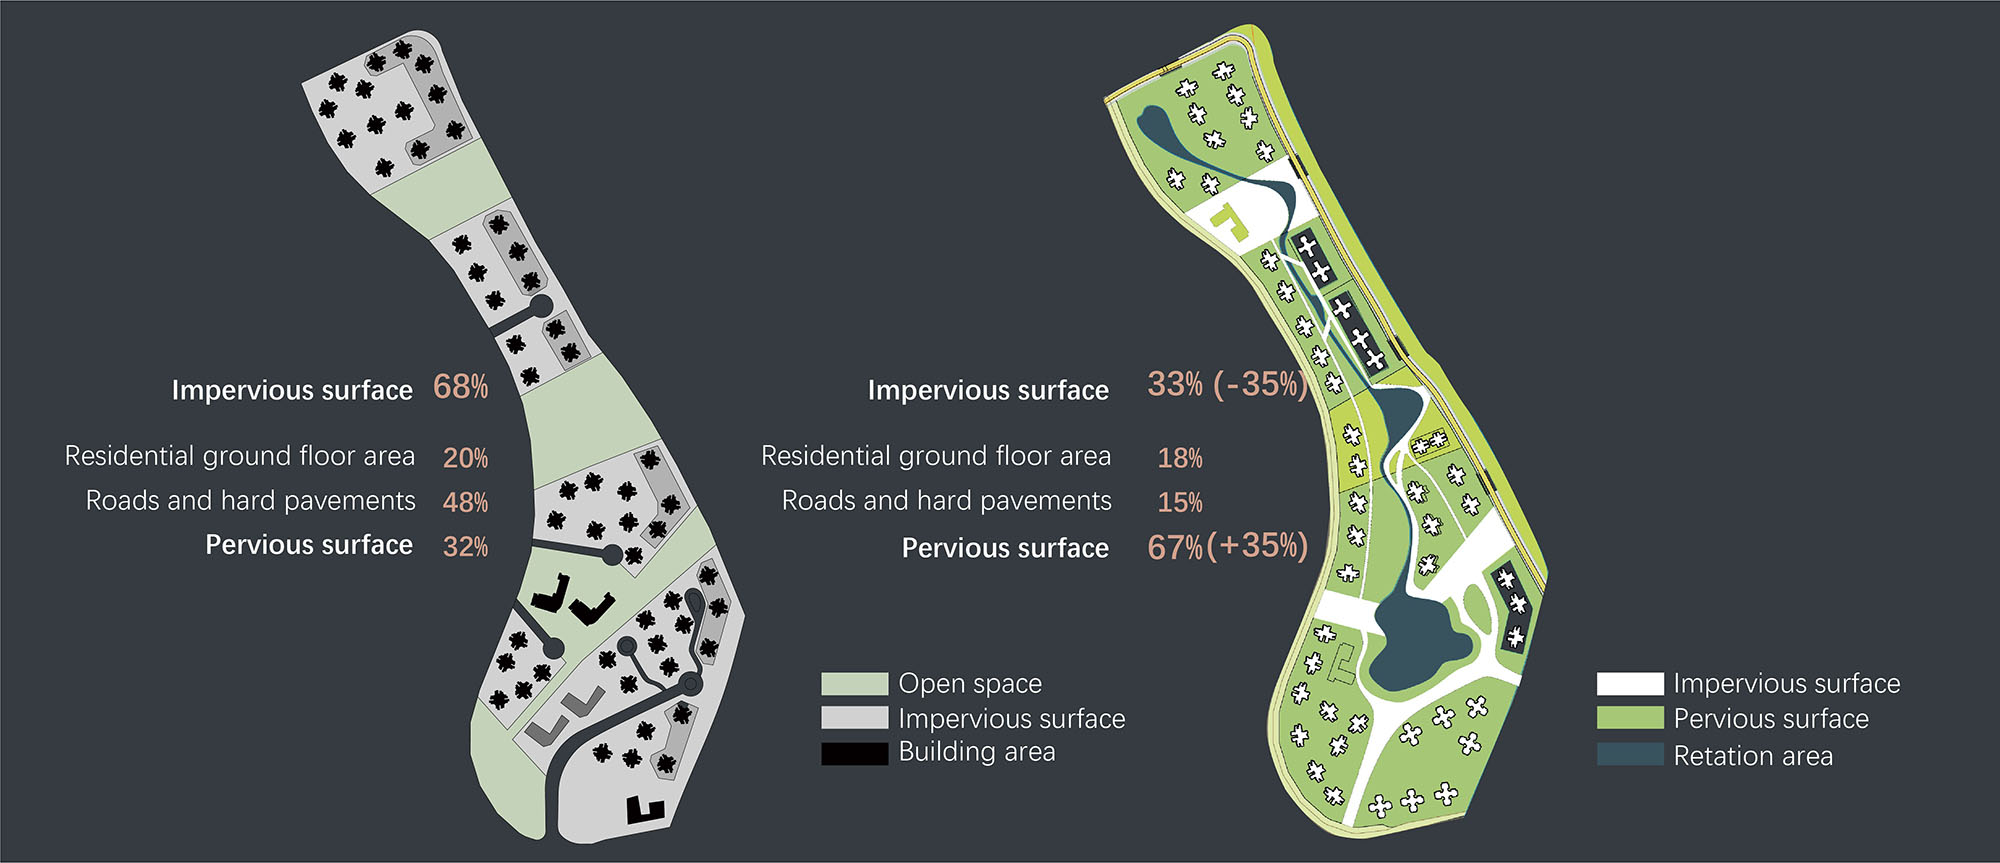
Figure 20. Residential area, source: Author
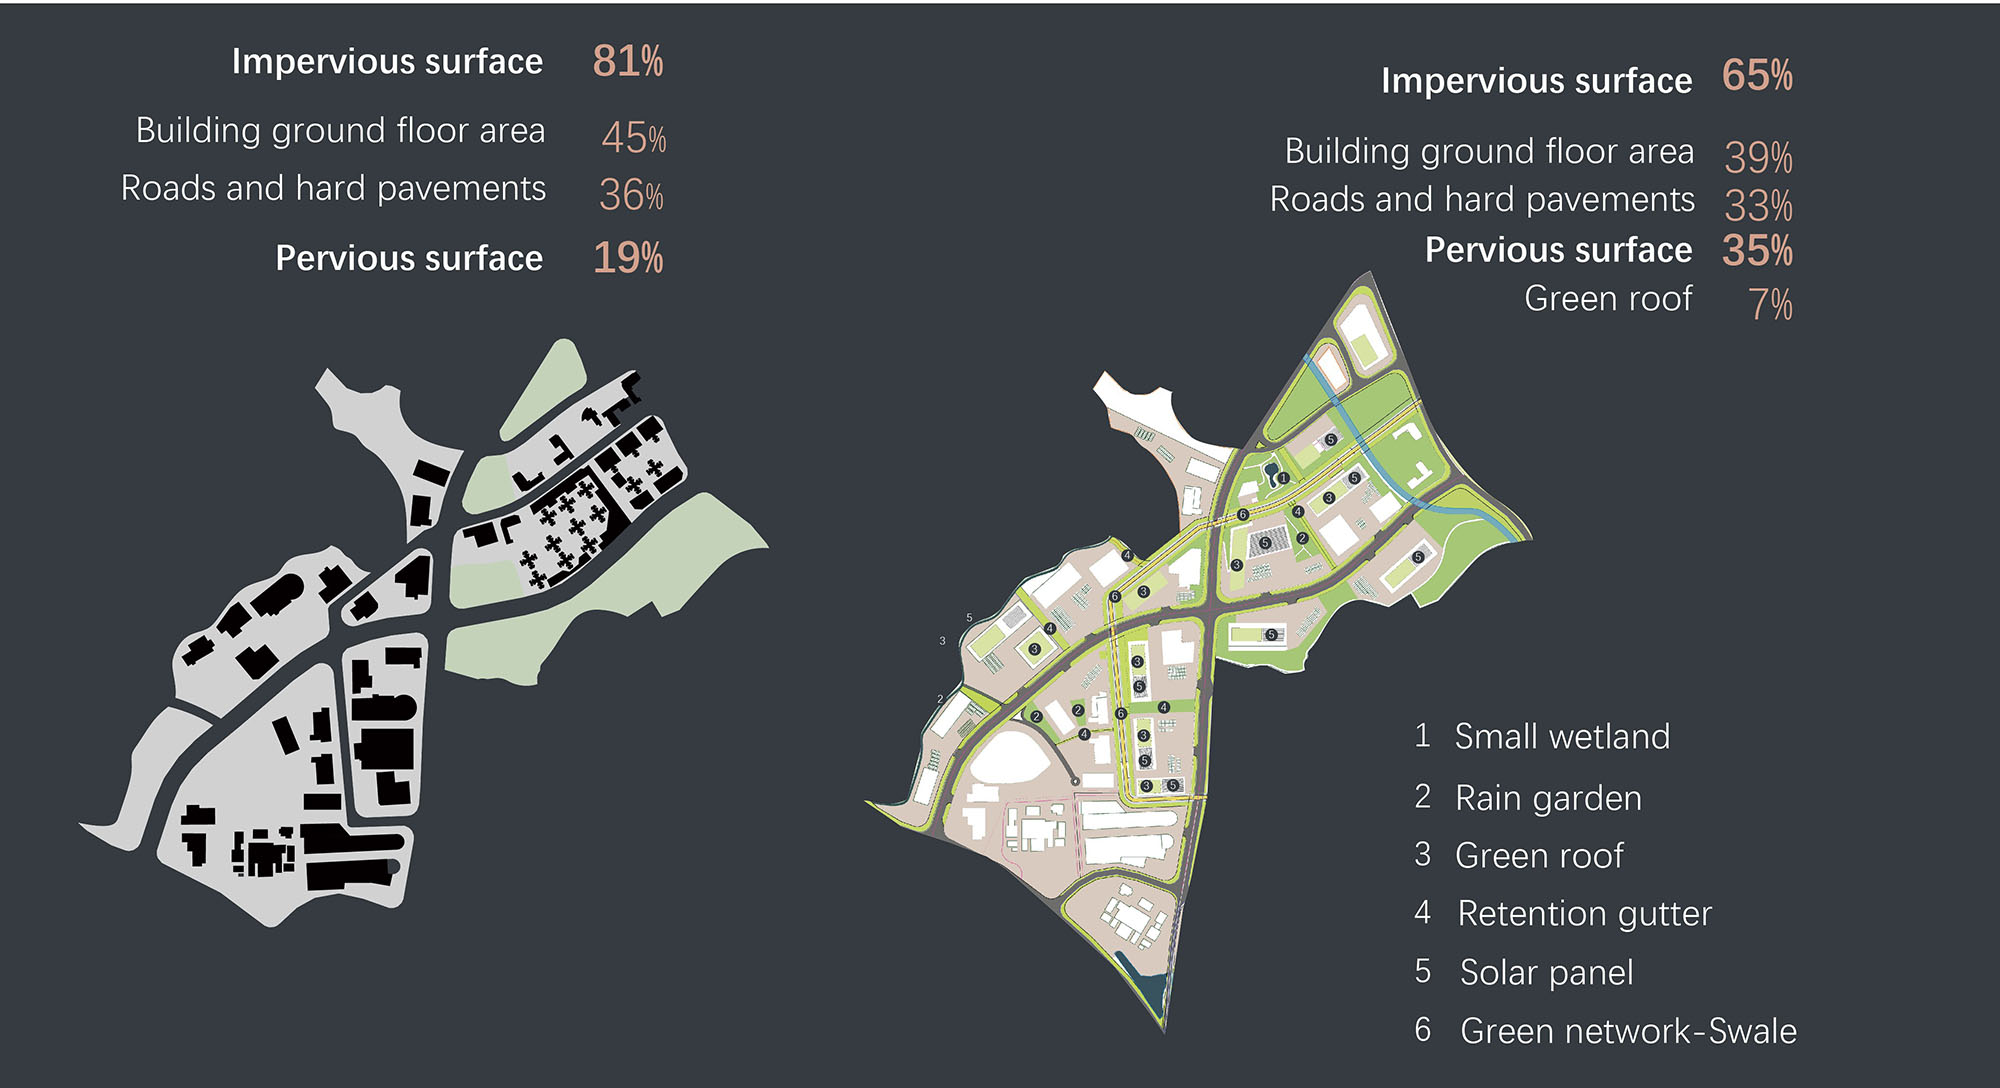
Figure 21. Logistic industrial area, source: Author
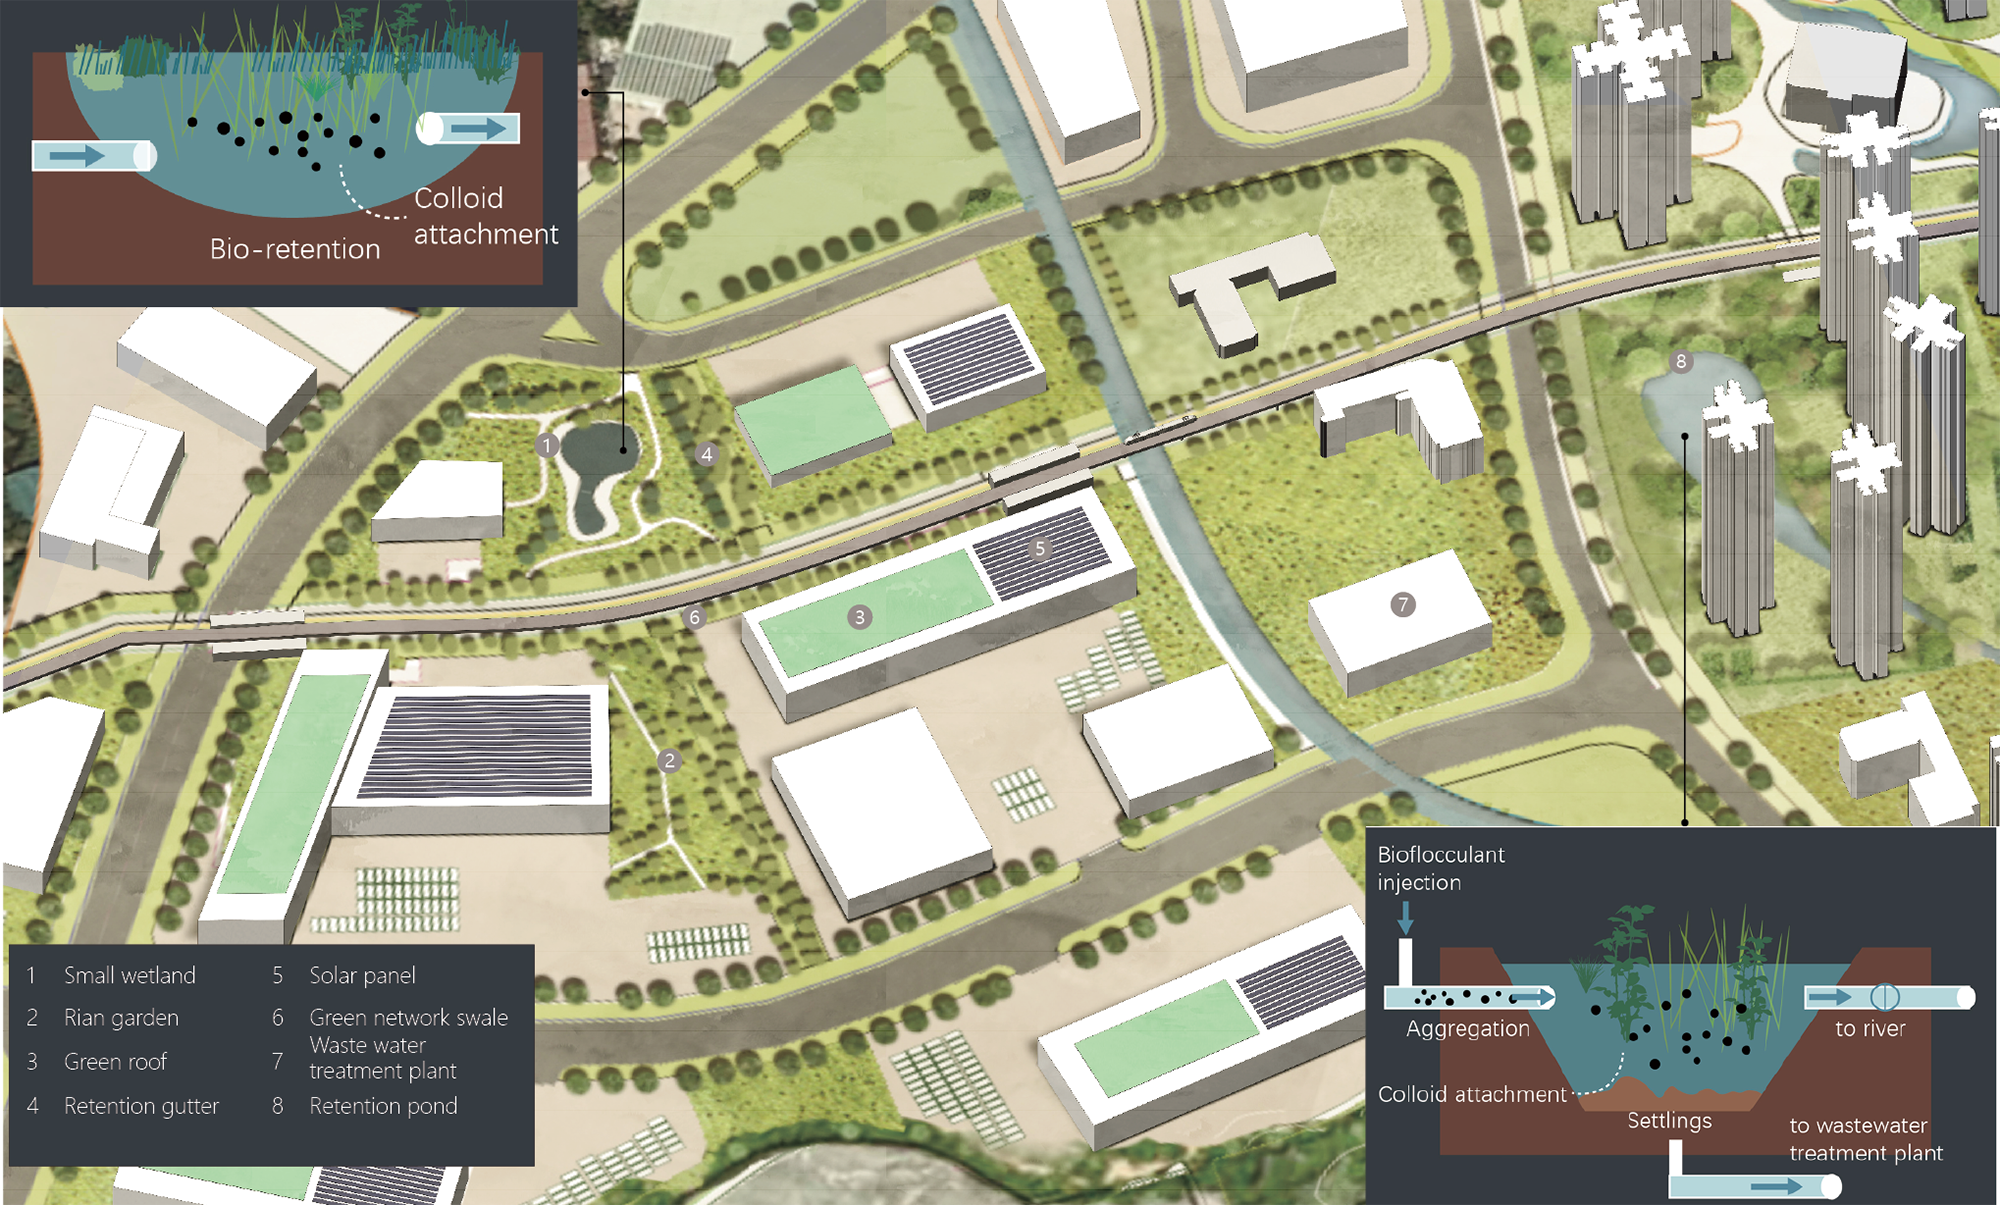
Figure 22. The distribution of green infrastructure, source: Author
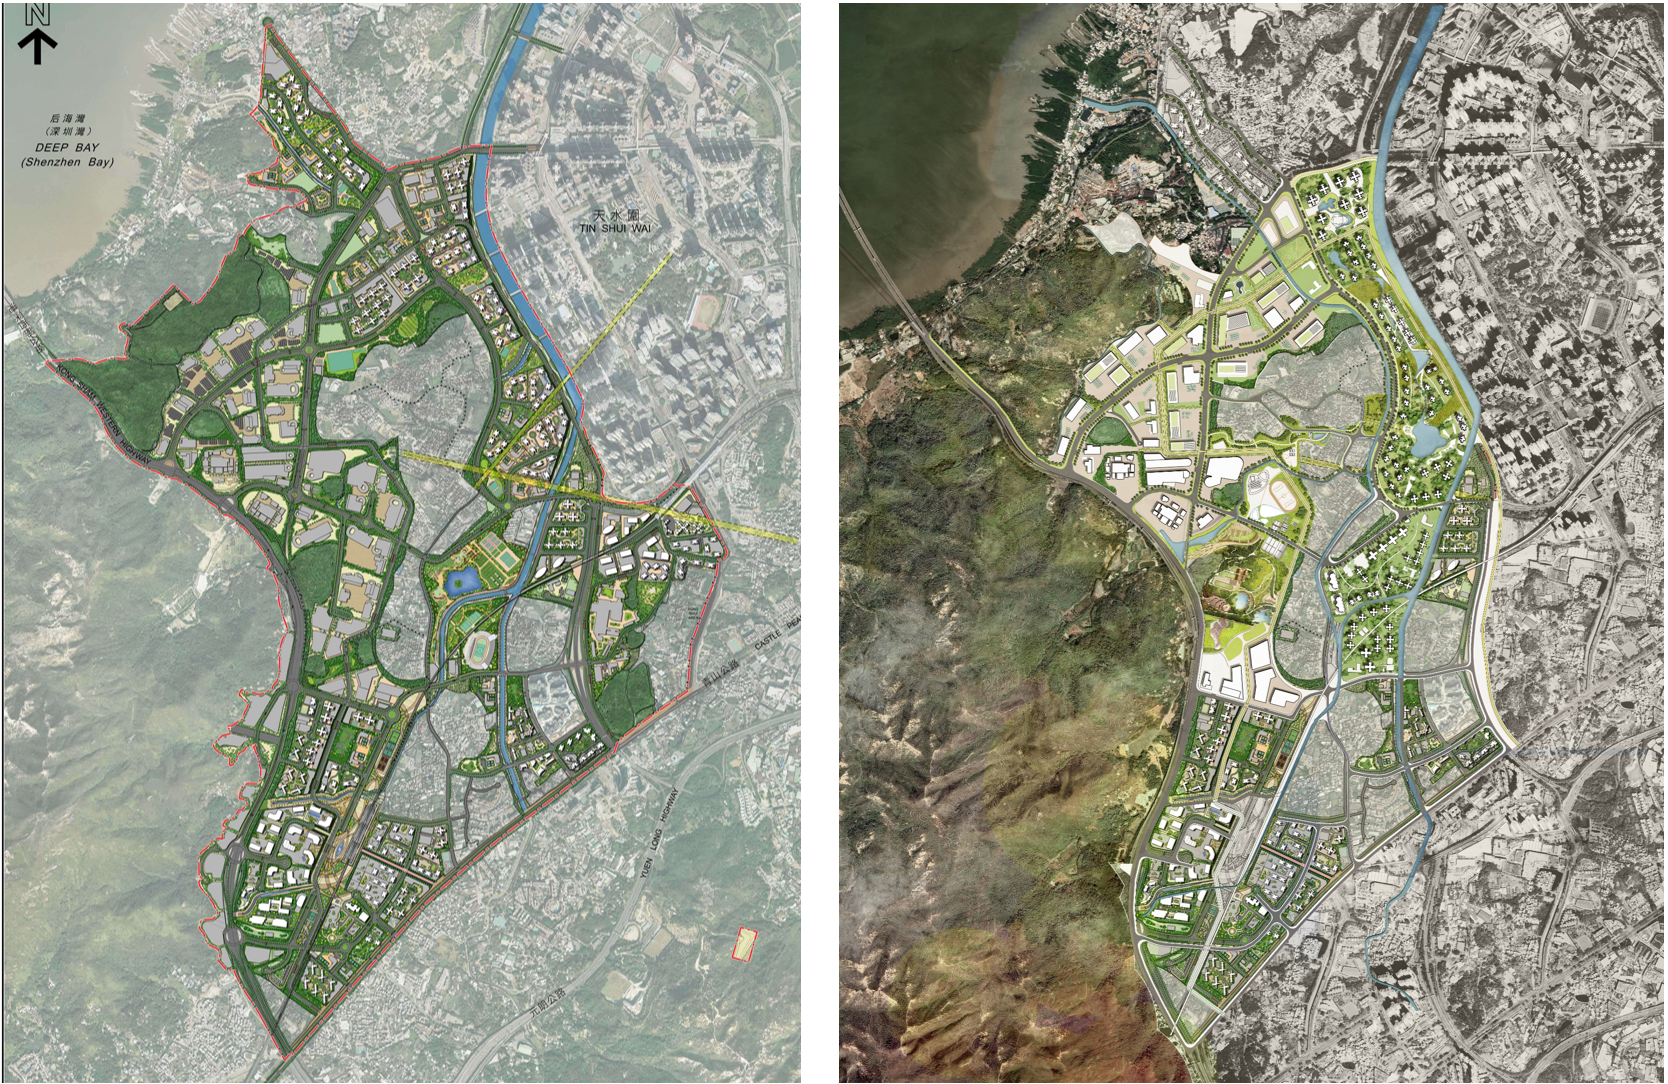
Figure 23. Comparison of the planes of the two schemes, source: planed.gov.hk. D_HKS_1_en(left); Author(right)
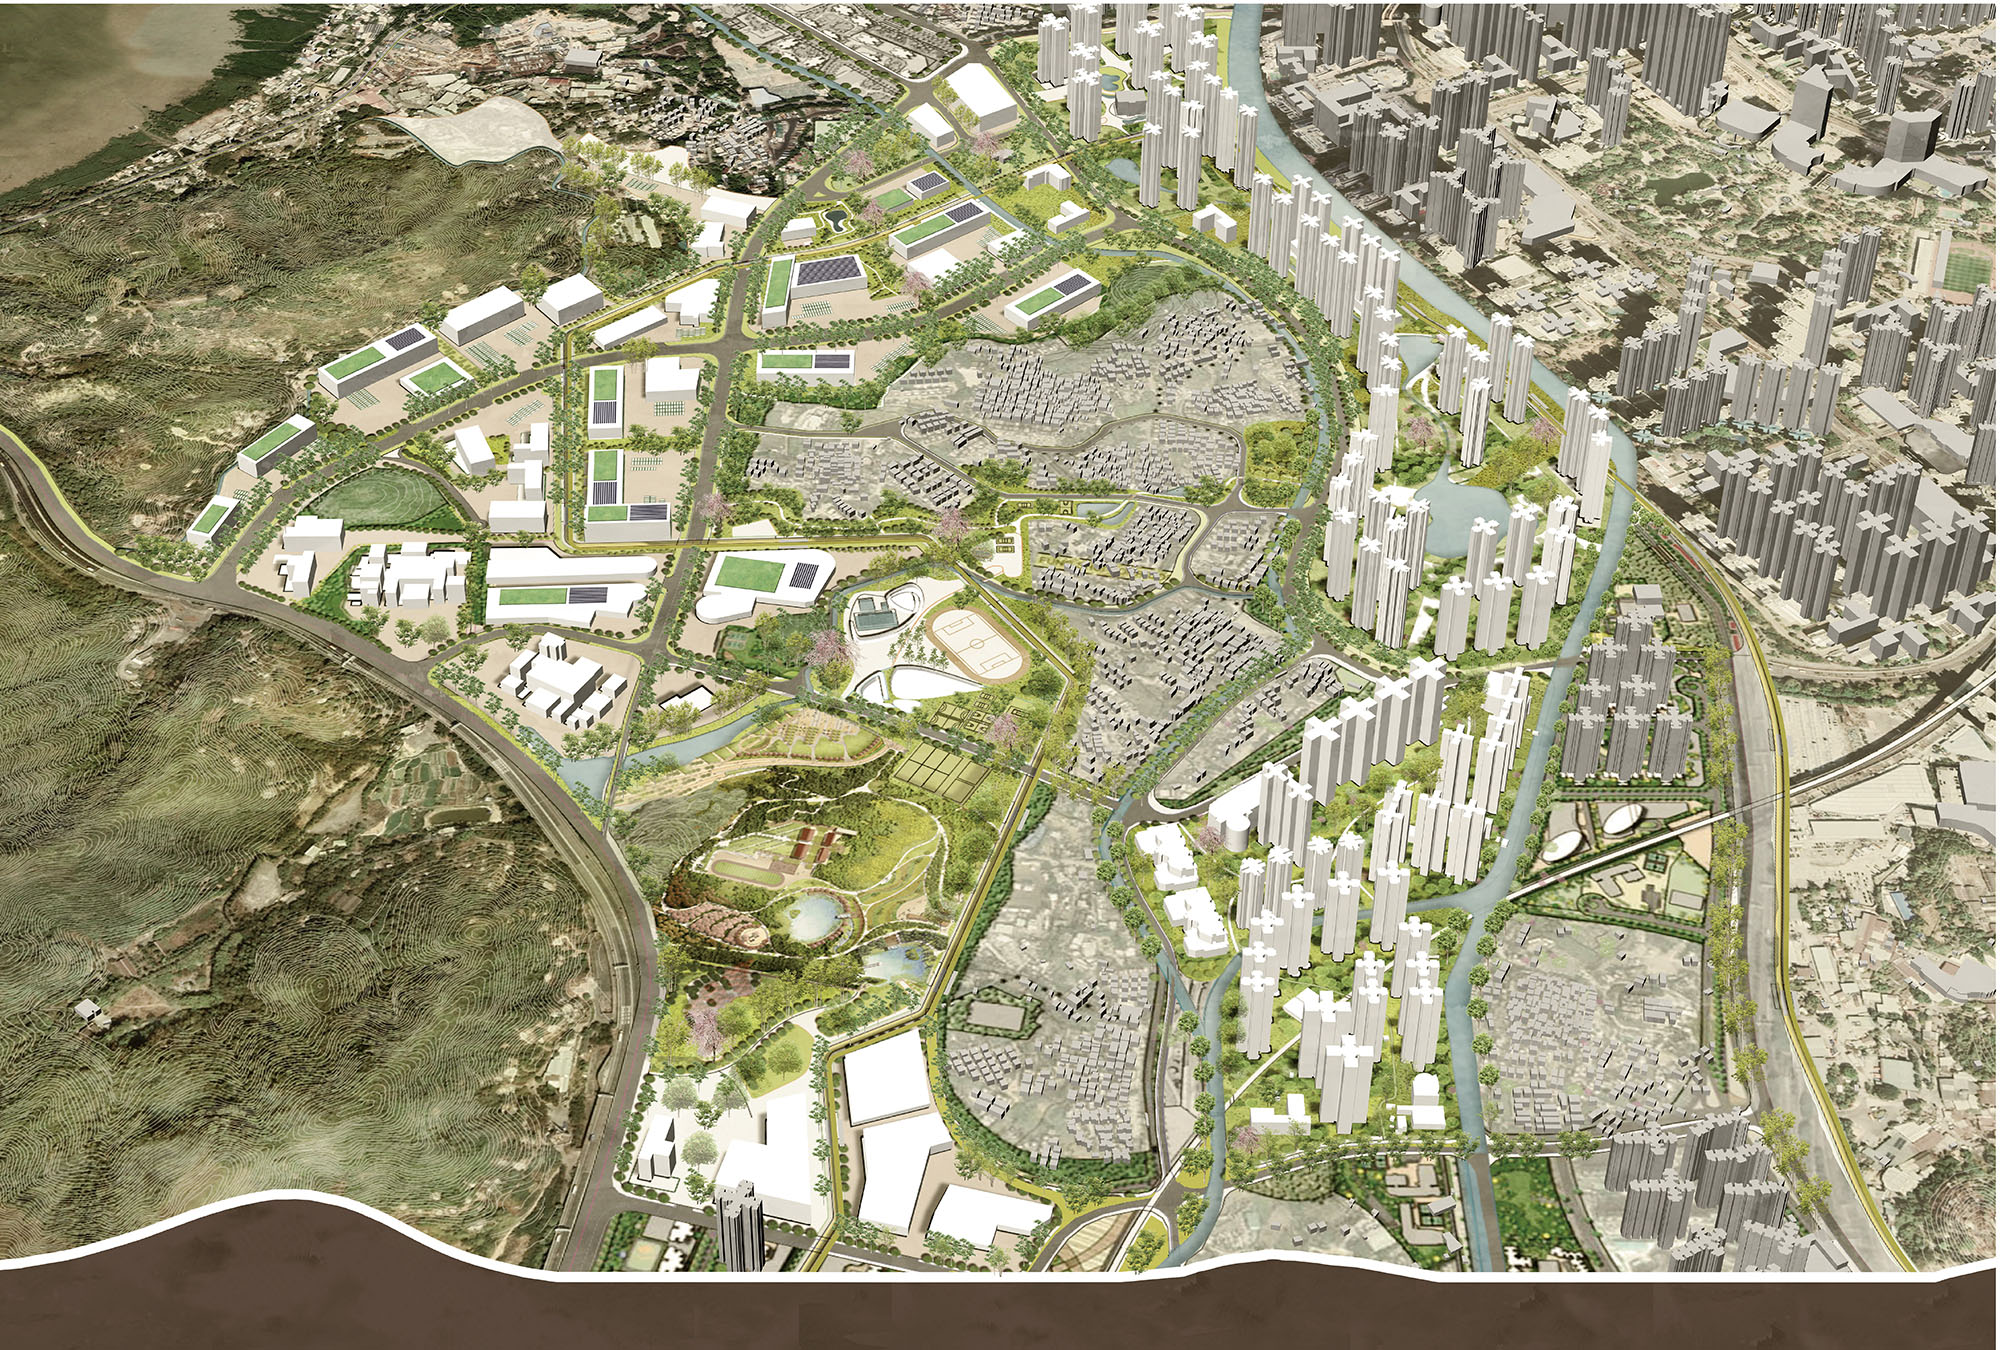
Figure 24. Overall aerial view, source: Author